Optimising and Visualising Go Tests Parallelism: Why more cores don't speed up your Go tests
Recently, I struggled for a couple of hours to understand why the API tests of one project were slow. In theory, we designed tests to run in a fully parallel way – the duration of tests should be close to the longest-running test. Unfortunately, the reality was different. Tests took 7x longer than the slowest test without using 100% available resources.
In this article, I will show you a few techniques to help you understand and optimize your tests execution. Optimizing tests that use CPU efficiently is simple (in most cases just add more resources). We’ll focus on a scenario of optimizing single-threaded, CPU-heavy integration, component, API, and E2E tests.
It’s hard to fix a problem that you can’t see
It’s difficult to understand how tests run from the output generated by go test.
You can see how long each test took, but you don’t know how long a test waited to run.
You also can’t see how many tests ran in parallel.
It becomes even harder when your project has thousands of tests.
Surprisingly, I didn’t find any tool that helps visualize Go test execution. As a hobbyist frontend engineer, I decided to build my own over a weekend.
vgt the missing tool for Visualizing Go Tests
vgt can parse JSON Go test output to create a visualization.
The quickest way to use it is by calling:
go test -json ./... | go run github.com/roblaszczak/vgt@latest
or by installing and running
go install -u github.com/roblaszczak/vgt
go test -json ./... | vgt
In a perfect world, this is how ideal test execution of tests that are not CPU-bound should look:
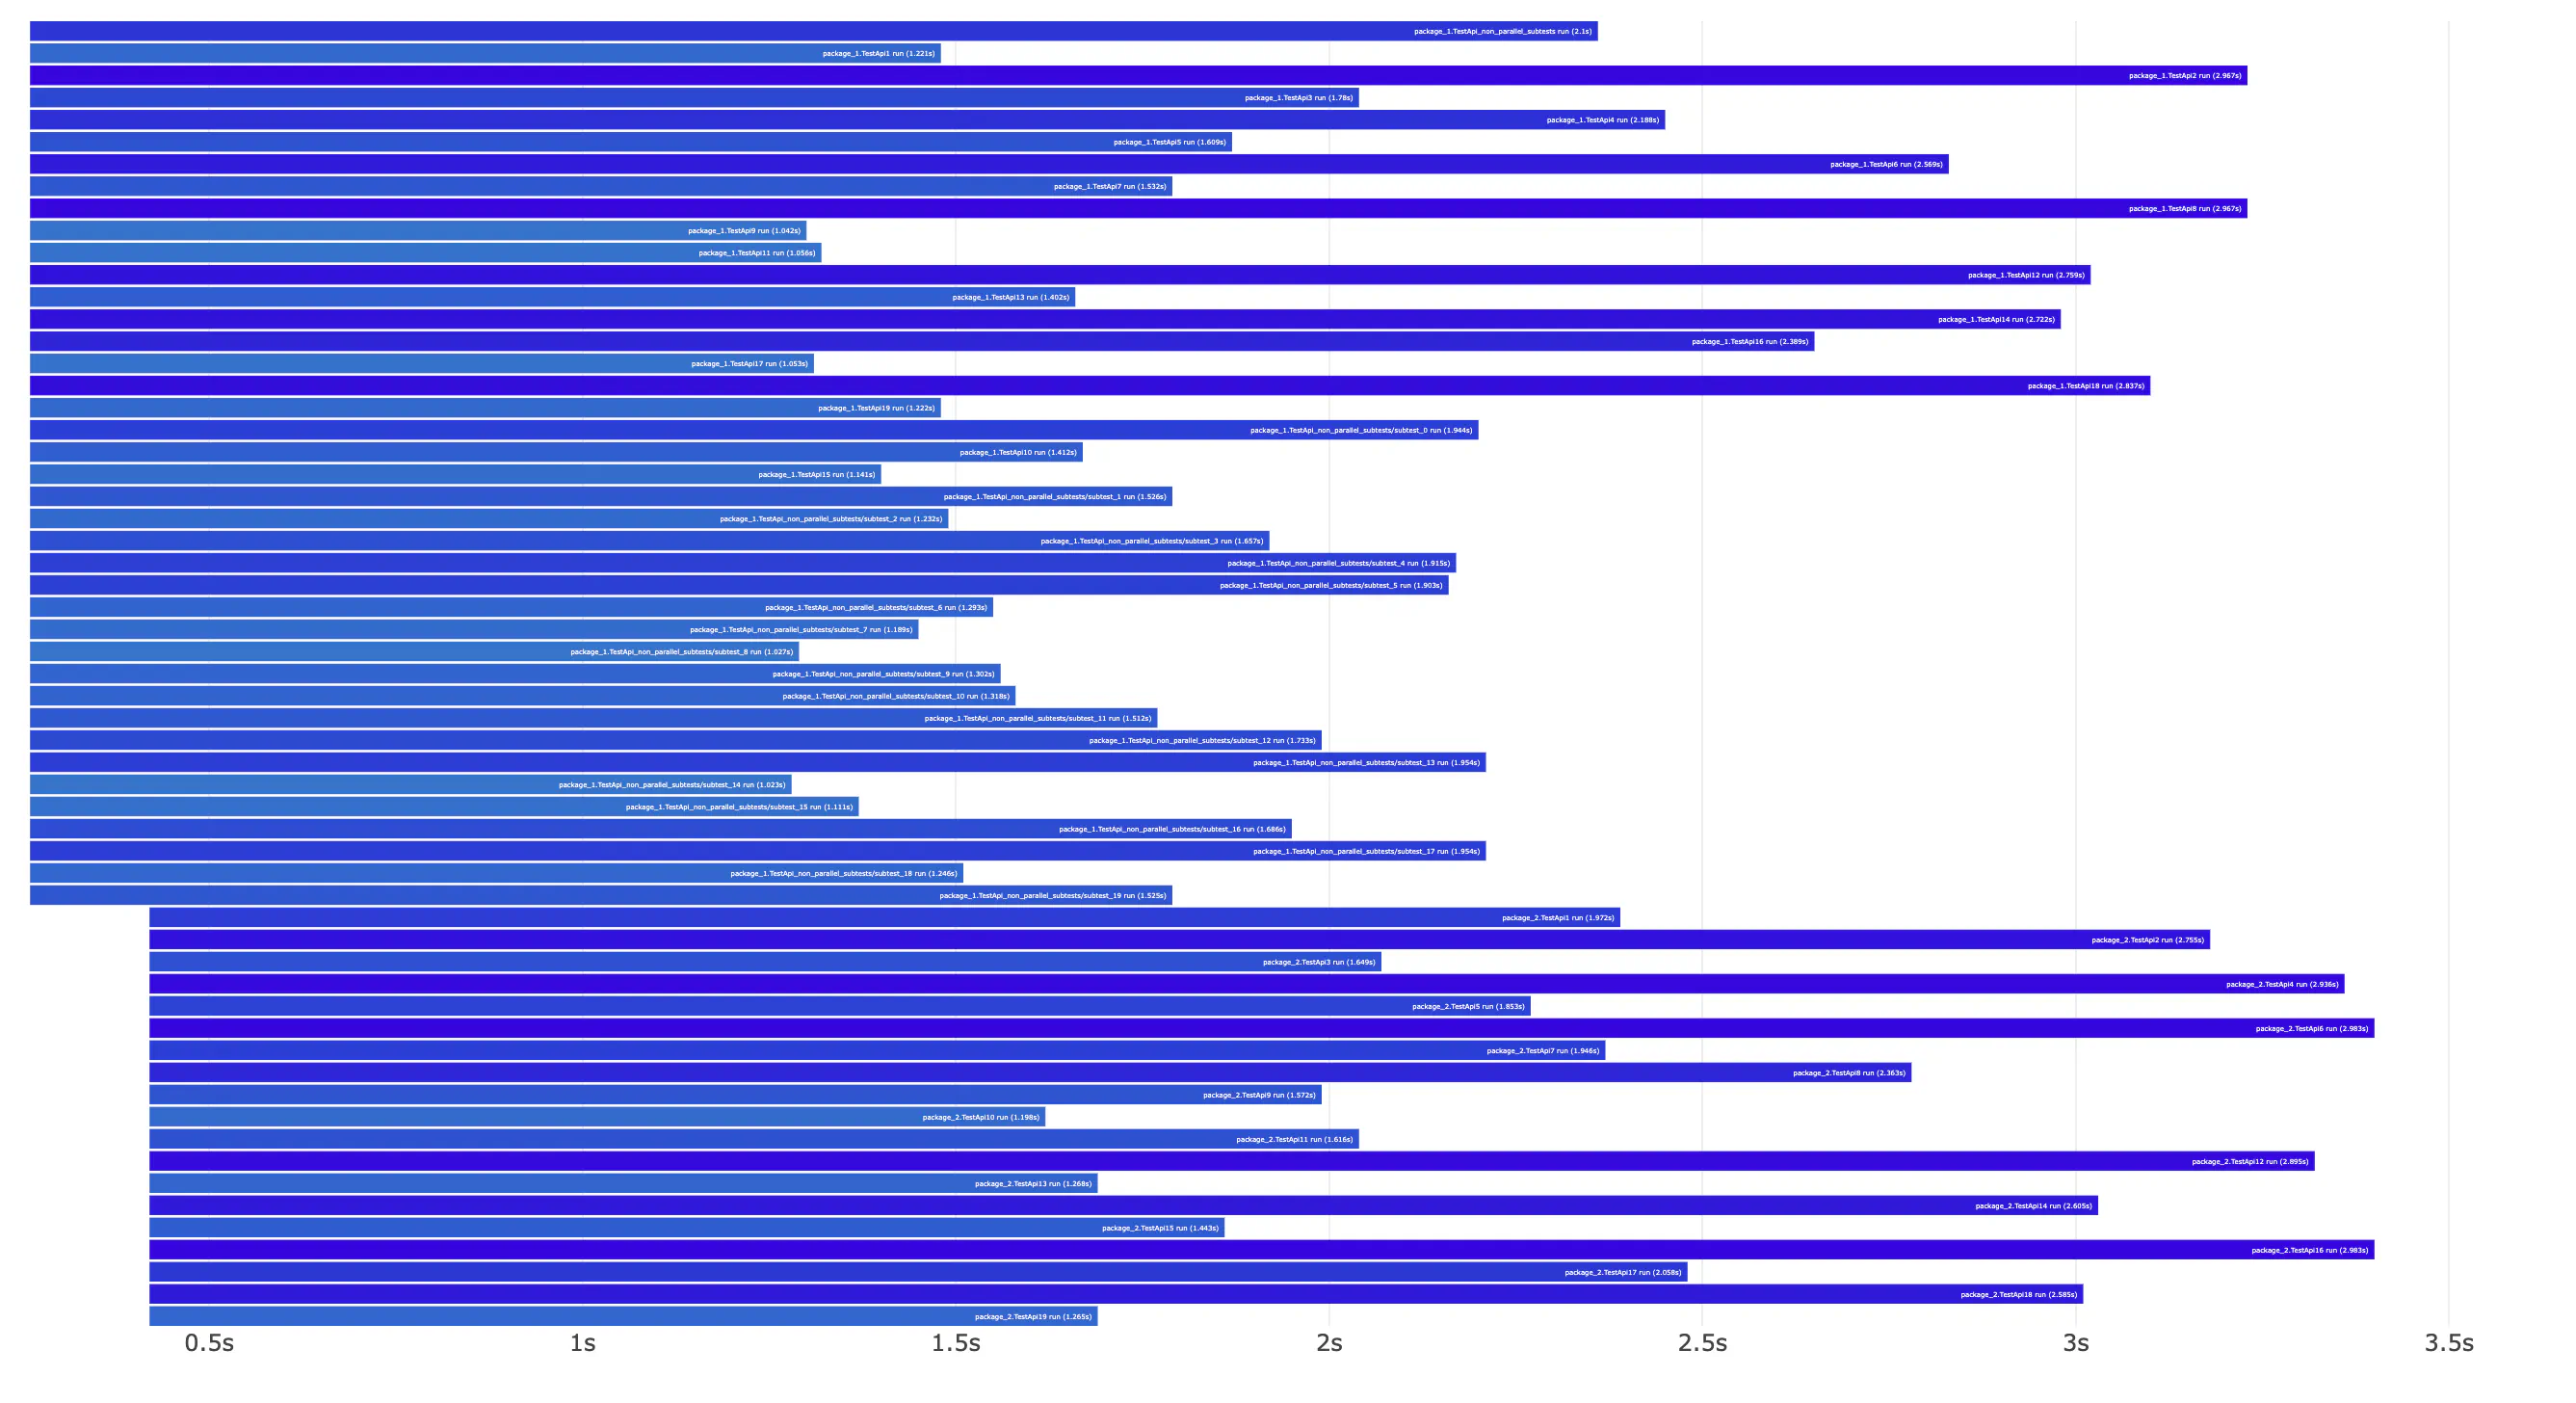
Each bar represents the test execution time of a single test or subtest. Unfortunately, the tests I was recently debugging looked more like this:
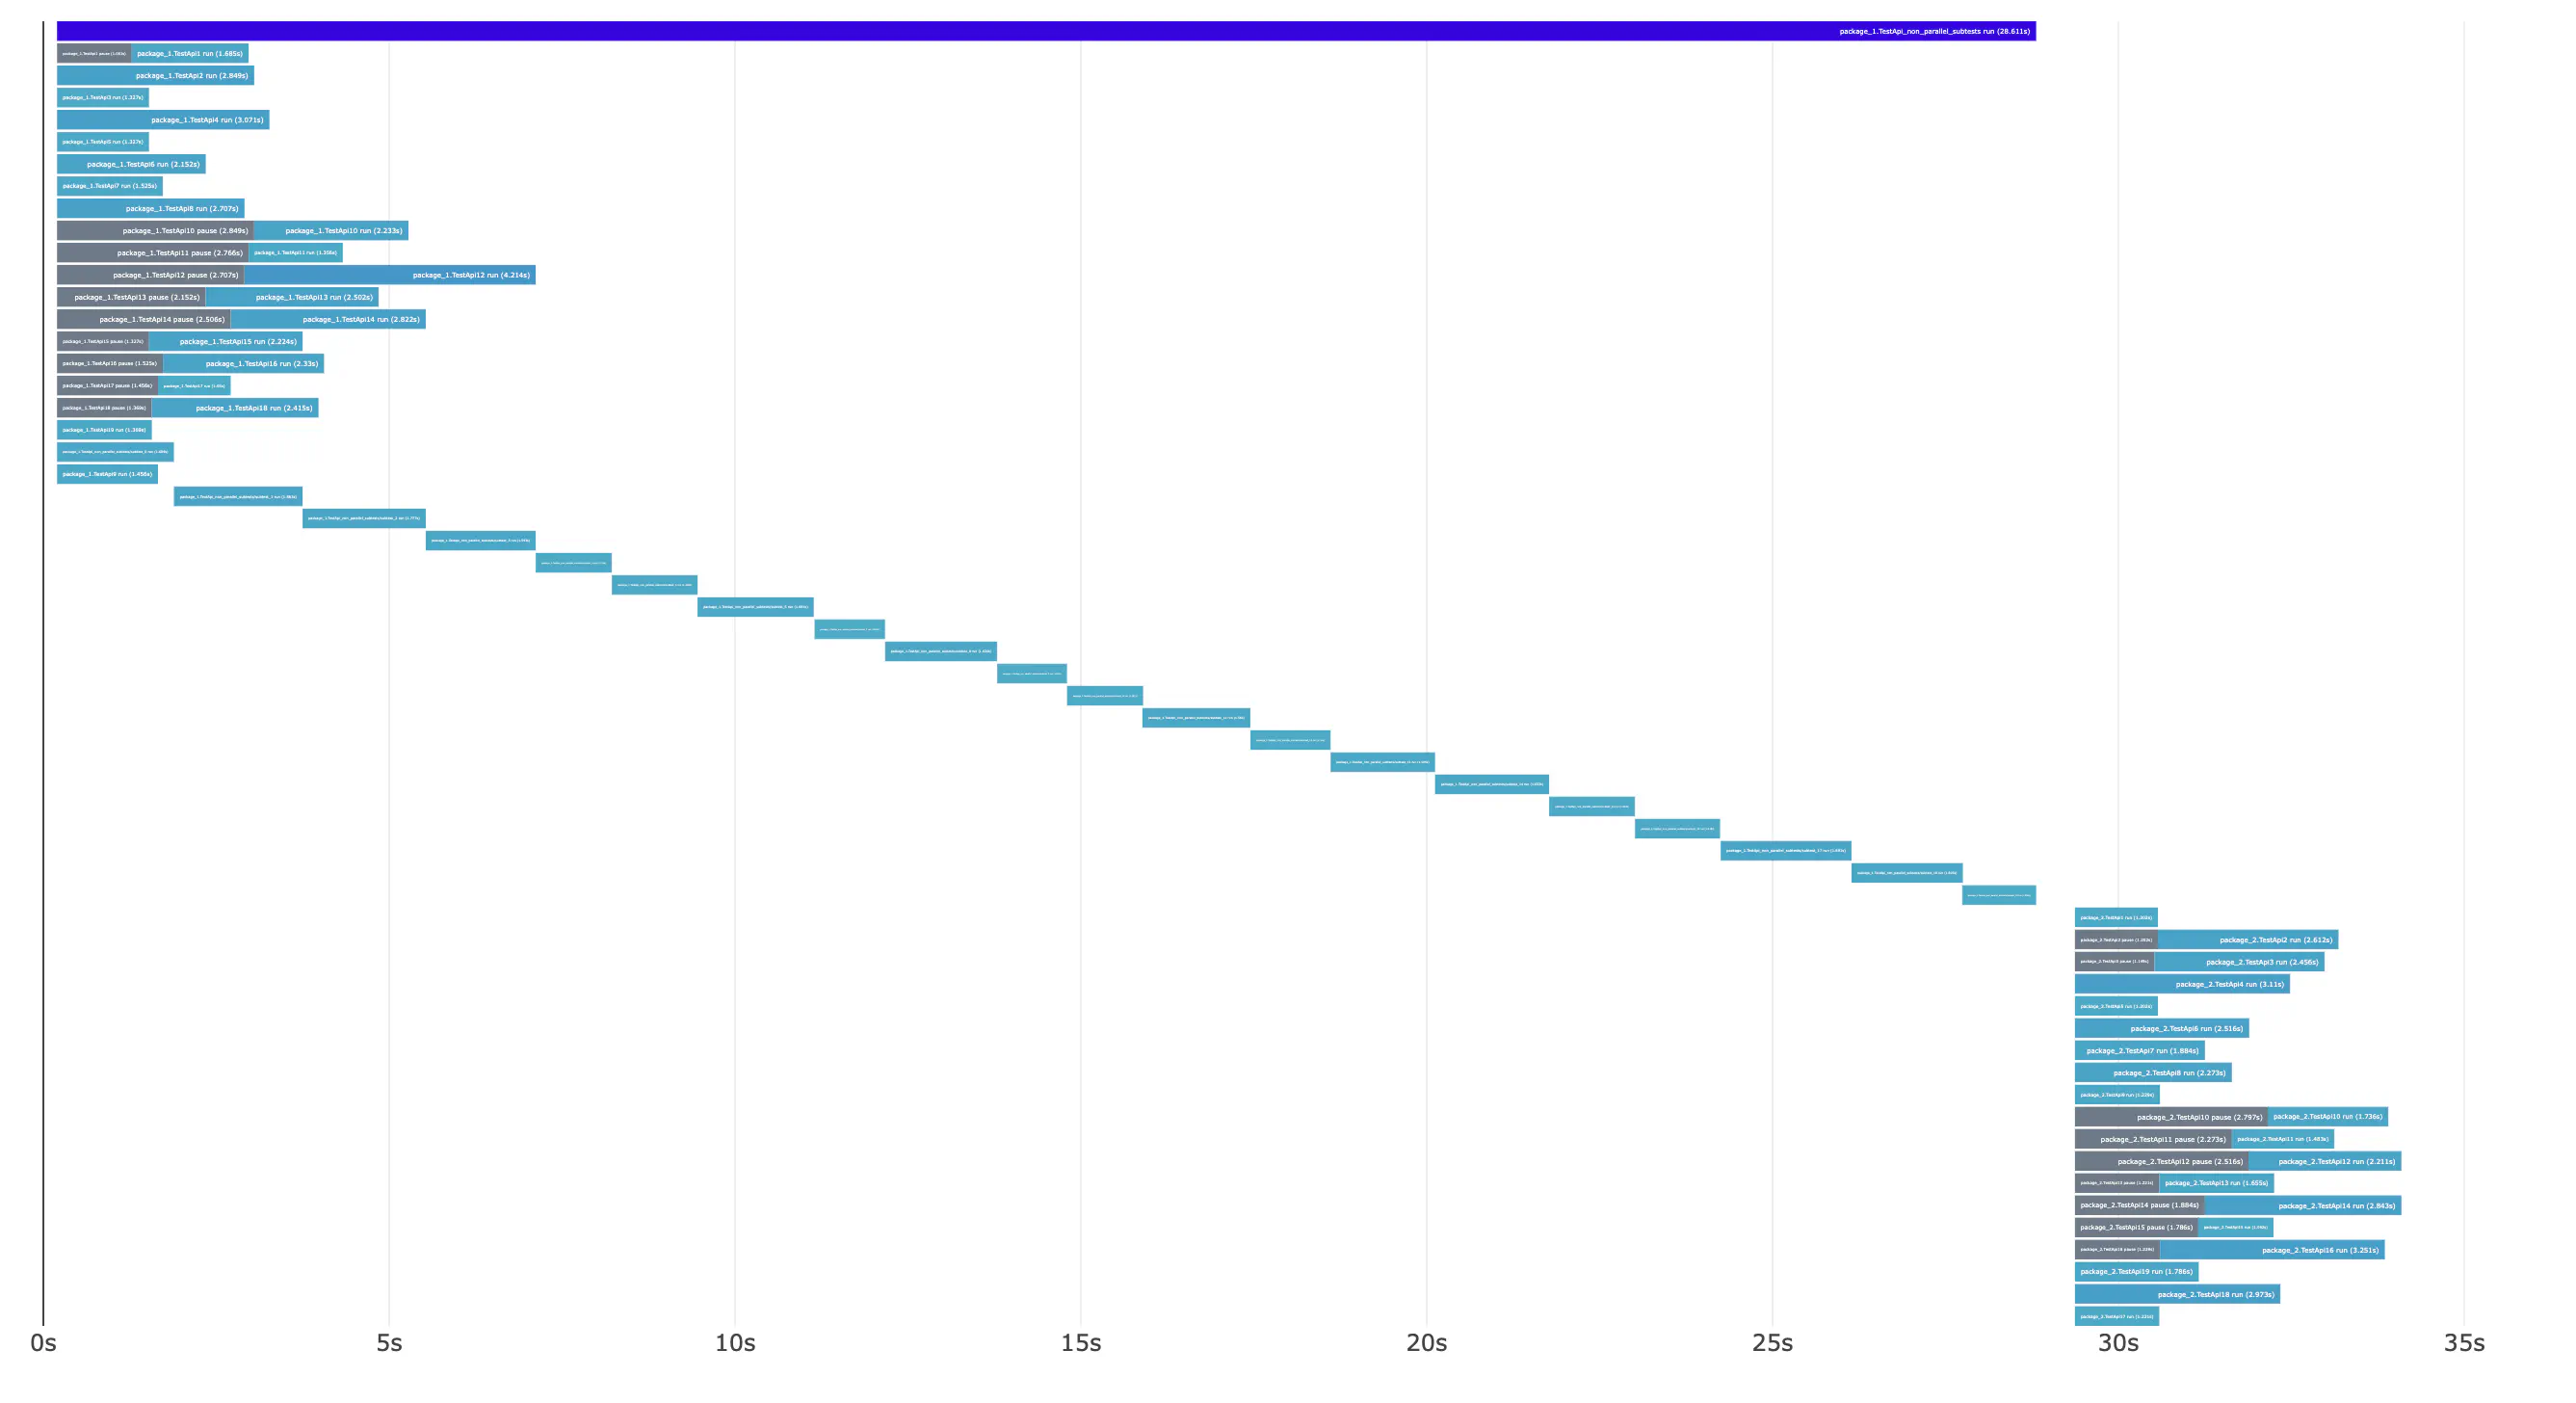
While the CPU was not fully used, tests ran one by one. It is also a good sign: we have a big room for improvement.
Parallelizing Go tests
By default, in Go all tests within a single package are run sequentially. This is not a problem when tests use all CPU cores efficiently and tests are split into multiple packages. But our CPU wastes cycles when a database query, API call, or sleep blocks tests – especially if we have a lot of tests in a single package.
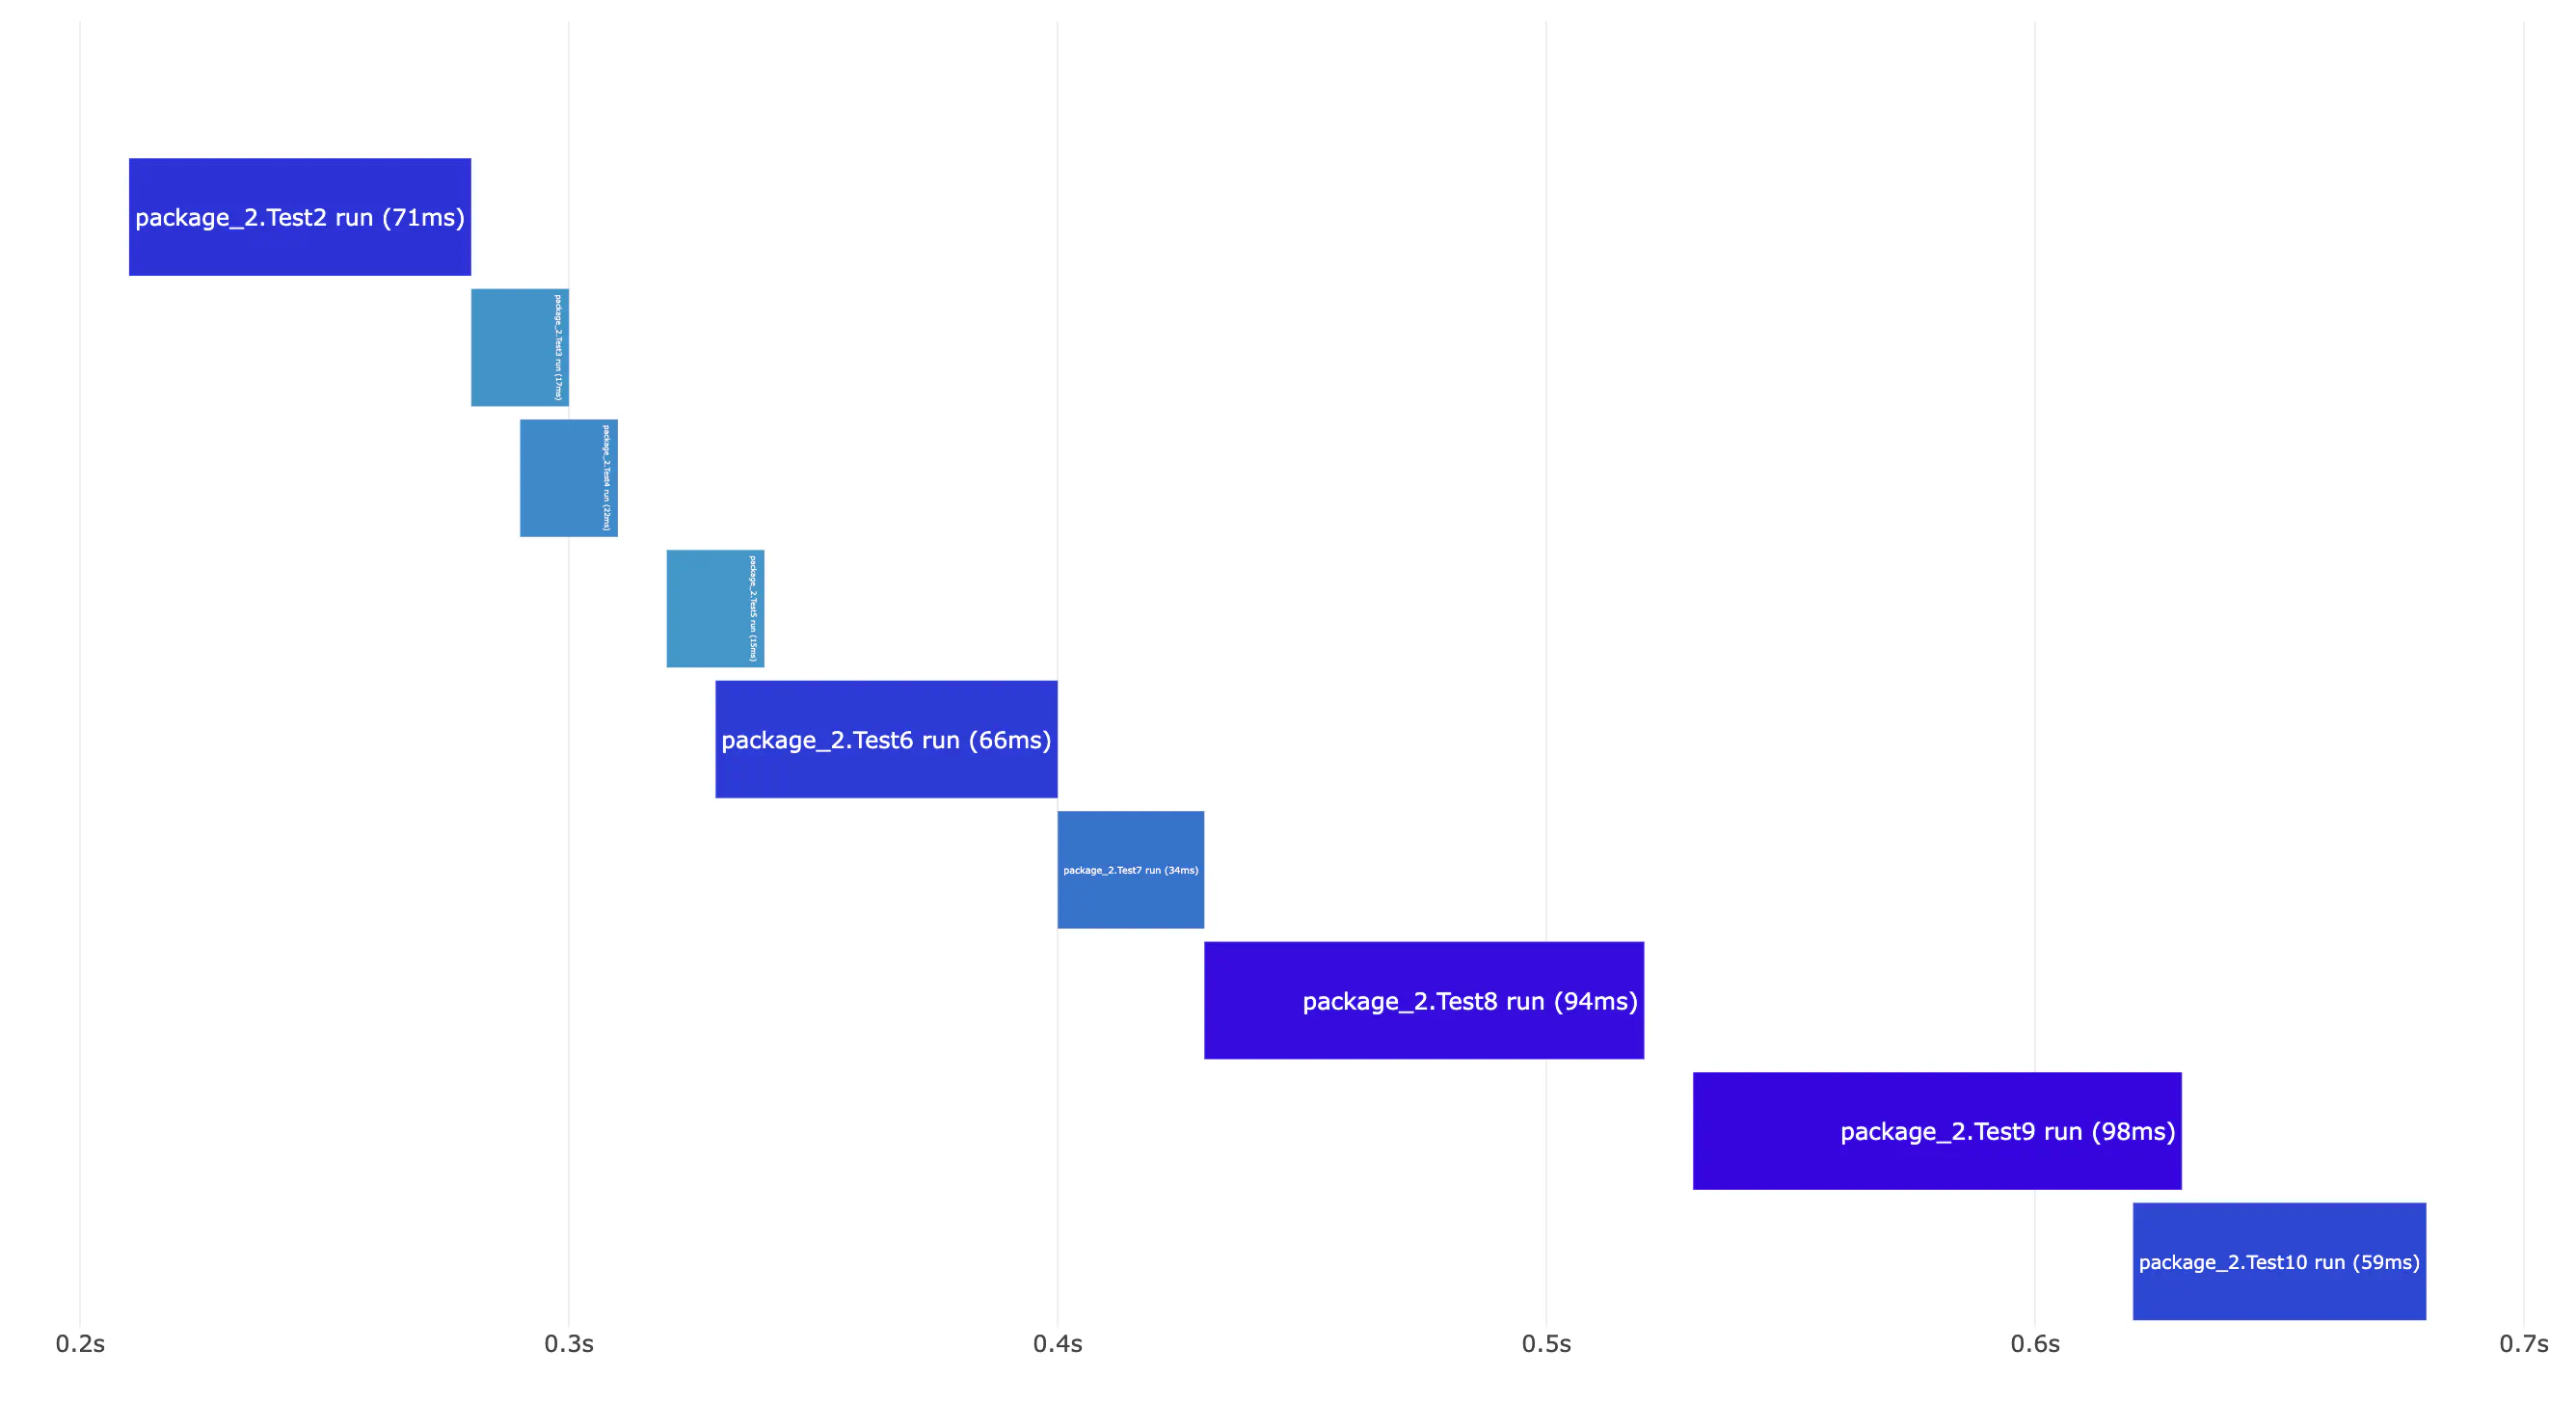
To fix this problem, *testing.T provides the t.Parallel() method,
which allows tests and sub-tests to run in parallel.
Warning
t.Parallel() is not a silver bullet and should be used with caution.
Use t.Parallel() only for tests that have blocking operations like database queries, API calls, sleeps.
It can also make sense for CPU-heavy tests using only a single-core.
For fast unit tests the overhead of using t.Parallel() will be higher than running them sequentially.
In other words, using t.Parallel() for lightweight unit tests will likely make them slower.
Parallelism limit
Even if you use t.Parallel(), it doesn’t mean that all tests will run in parallel.
To simulate this scenario, I wrote an example test that will simulate 100 tests doing API calls.
func TestApi_parallel_subtests(t *testing.T) {
    t.Parallel()

    for i := 0; i < 100; i++ {
       t.Run(fmt.Sprintf("subtest_%d", i), func(t *testing.T) {
          t.Parallel()
          simulateSlowCall(1 * time.Second)
       })
    }
}

func simulateSlowCall(sleepTime time.Duration) {
    time.Sleep(sleepTime + (time.Duration(rand.Intn(1000)) * time.Millisecond))
}
As long as the target server is not overloaded and tests are appropriately designed, we should be able to run all tests in parallel. In this case, running all tests should take at most 2 seconds. But it took over 16 seconds instead.
Despite using t.Parallel(), the execution graph shows many gray bars representing pauses.
Tests marked as PAUSED are limited due to the parallelism limit.
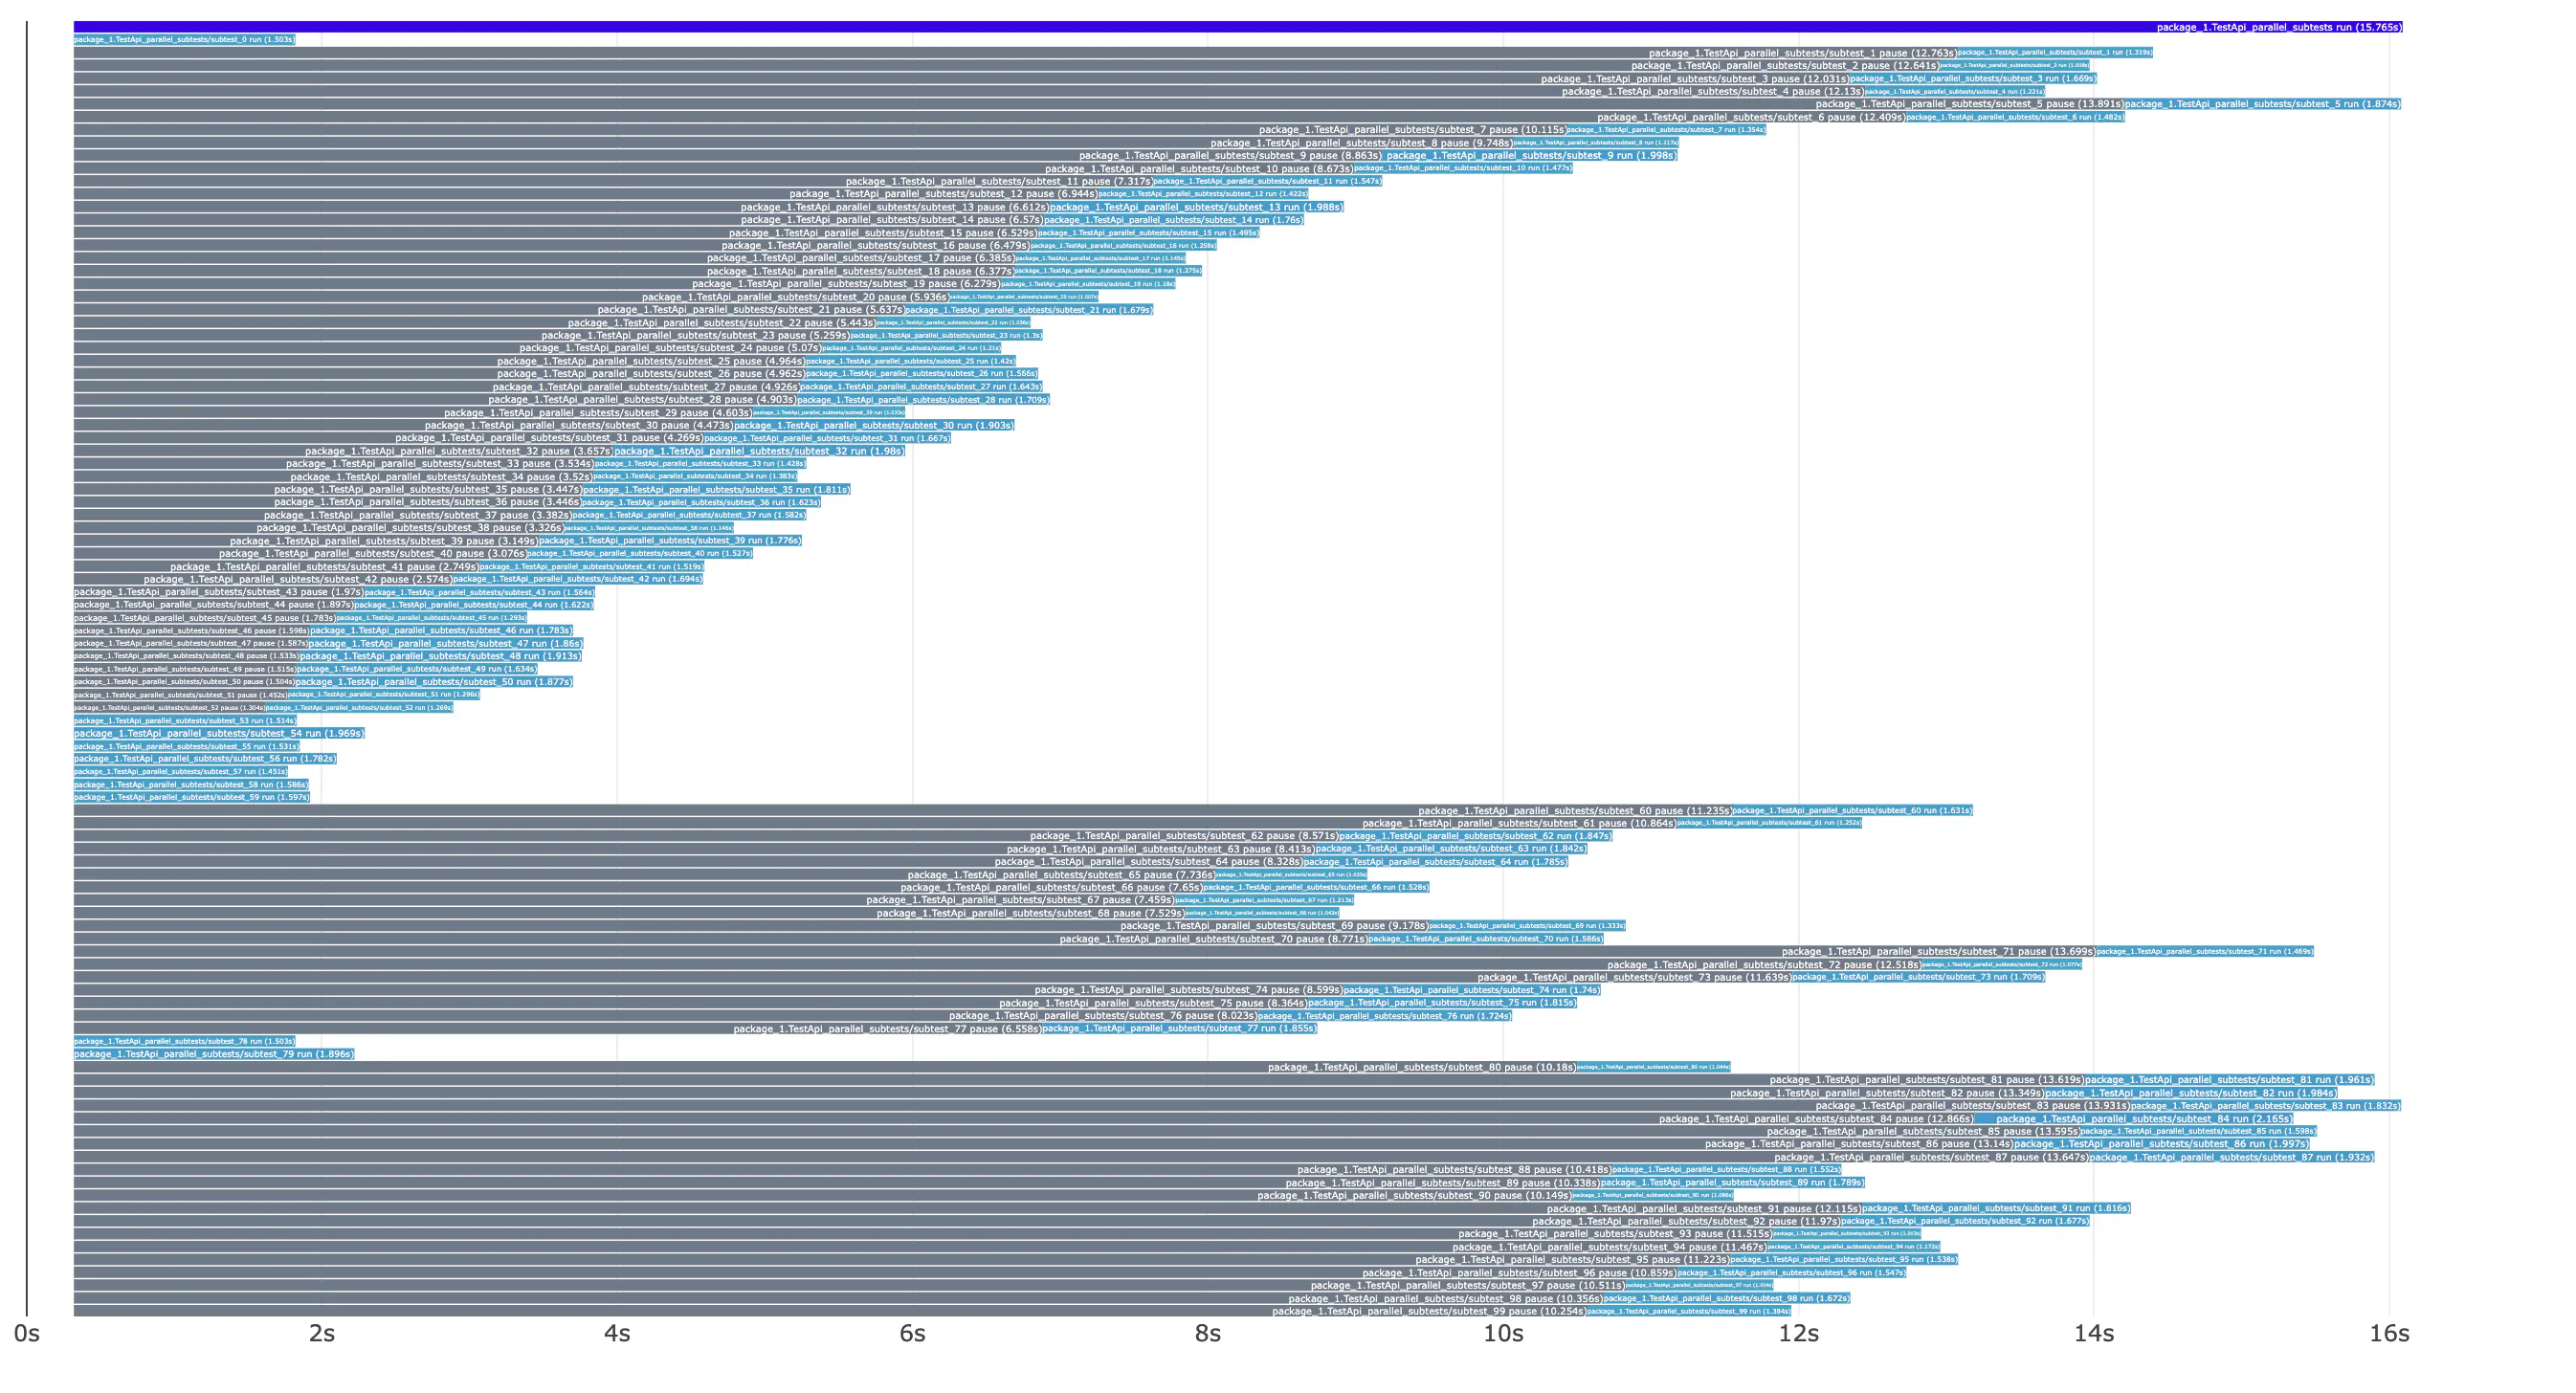
First, let’s understand how tests with t.Parallel() run. If you’re curious, you can check the
source code of the testing package.
What’s important, test parallelism is set to runtime.GOMAXPROCS(0) by default, which returns the number of cores reported by the OS.
parallel = flag.Int("test.parallel", runtime.GOMAXPROCS(0), "run at most `n` tests in parallel")
On my Macbook, runtime.GOMAXPROCS(0) returns 10 (as I have a 10-core CPU).
In other words, it limits tests run in parallel to 10.
Limiting tests to the number of our cores makes sense when they are CPU-bound. More parallelism will force our OS to do more expensive context switching. But when we are calling a database, API, or any blocking I/O, it makes tests longer without fully using our resources.
The situation can be even worse when API tests run in CI against an environment deployed in a separate VM or cloud.
Often, CI runners for API tests may have 1-2 CPUs.
With 1 vCPU, API tests will run one by one. We can simulate this by setting the env GOMAXPROCS=1.
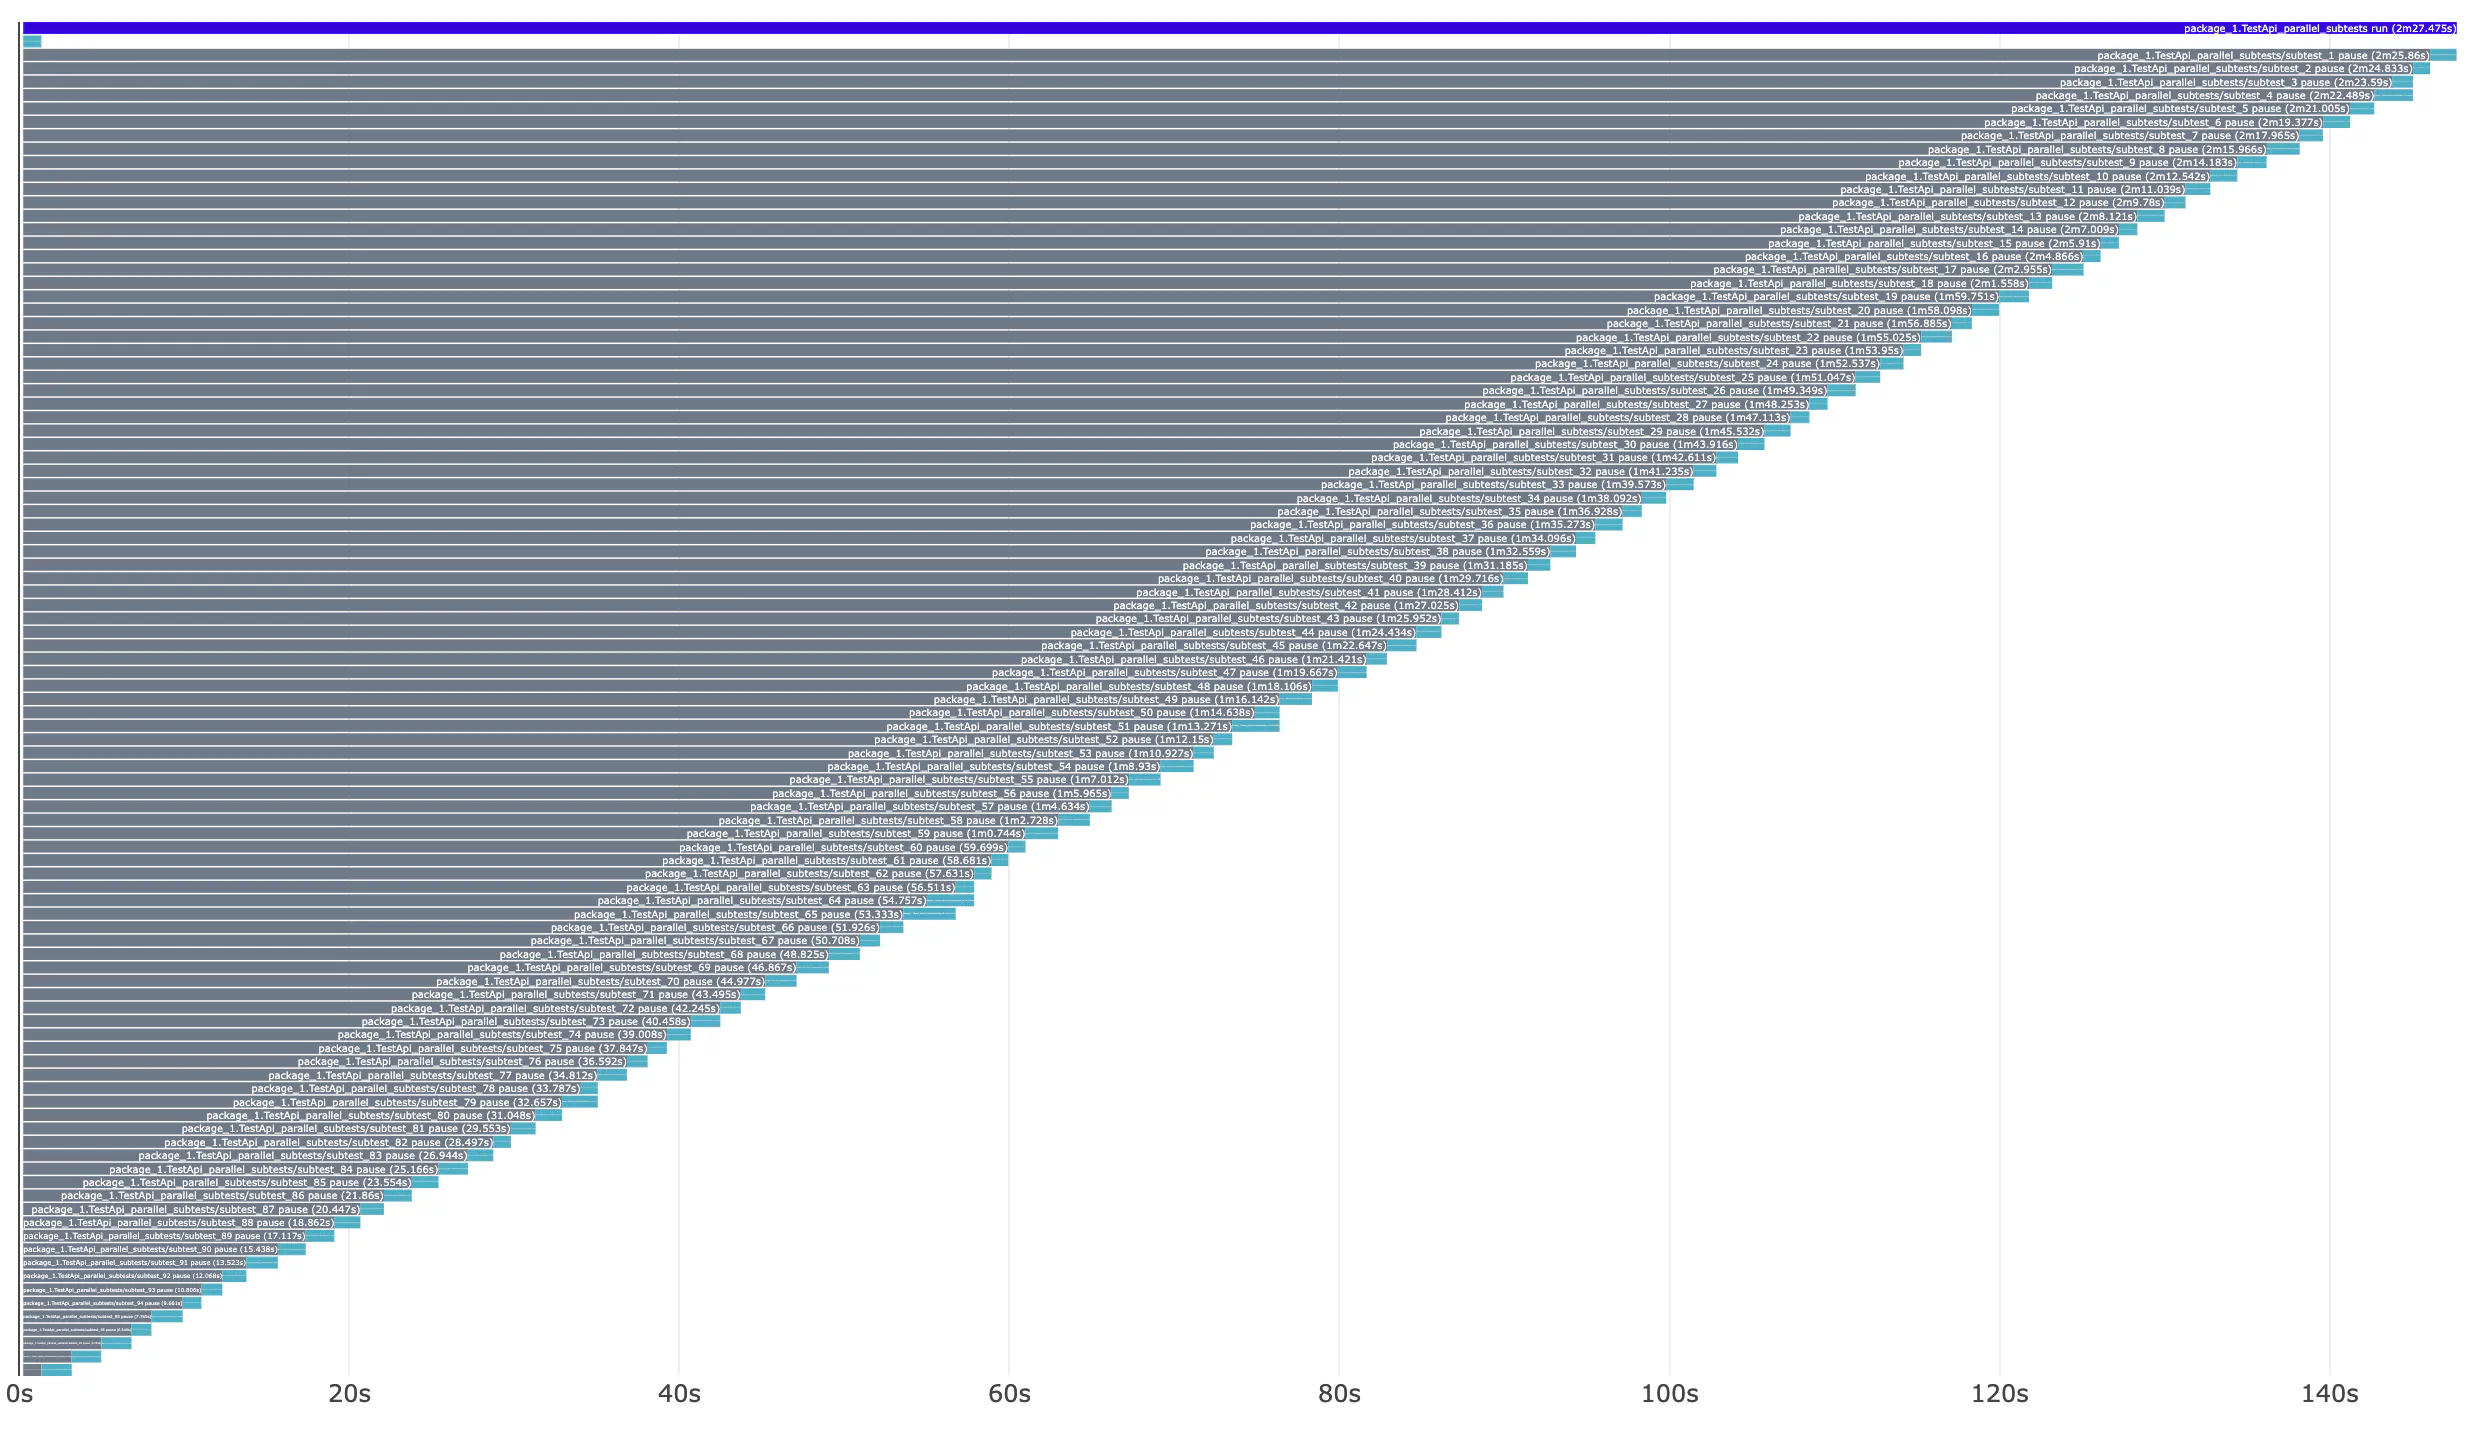
Parallelism is effectively set to 1, so we see a lot of gray bars representing waiting time.
To fix this problem, we can use the -parallel (or -test.parallel – they have the same effect) flag.
Go documentation says:
    -parallel n
        Allow parallel execution of test functions that call t.Parallel, and
        fuzz targets that call t.Parallel when running the seed corpus.
        The value of this flag is the maximum number of tests to run
        simultaneously.
        While fuzzing, the value of this flag is the maximum number of
        subprocesses that may call the fuzz function simultaneously, regardless of
        whether T.Parallel is called.
        By default, -parallel is set to the value of GOMAXPROCS.
        Setting -parallel to values higher than GOMAXPROCS may cause degraded
        performance due to CPU contention, especially when fuzzing.
        Note that -parallel only applies within a single test binary.
        The 'go test' command may run tests for different packages
        in parallel as well, according to the setting of the -p flag
        (see 'go help build').
Tip
Don’t change GOMACPROCS to a value higher than the available cores to force more parallelism.
It will have more effects than just on tests — it will spawn more Go threads than cores. It will lead to more expensive context switching and may slow down CPU-bound tests.
Let’s see how the same test will behave with the extra -parallel 100 flag:
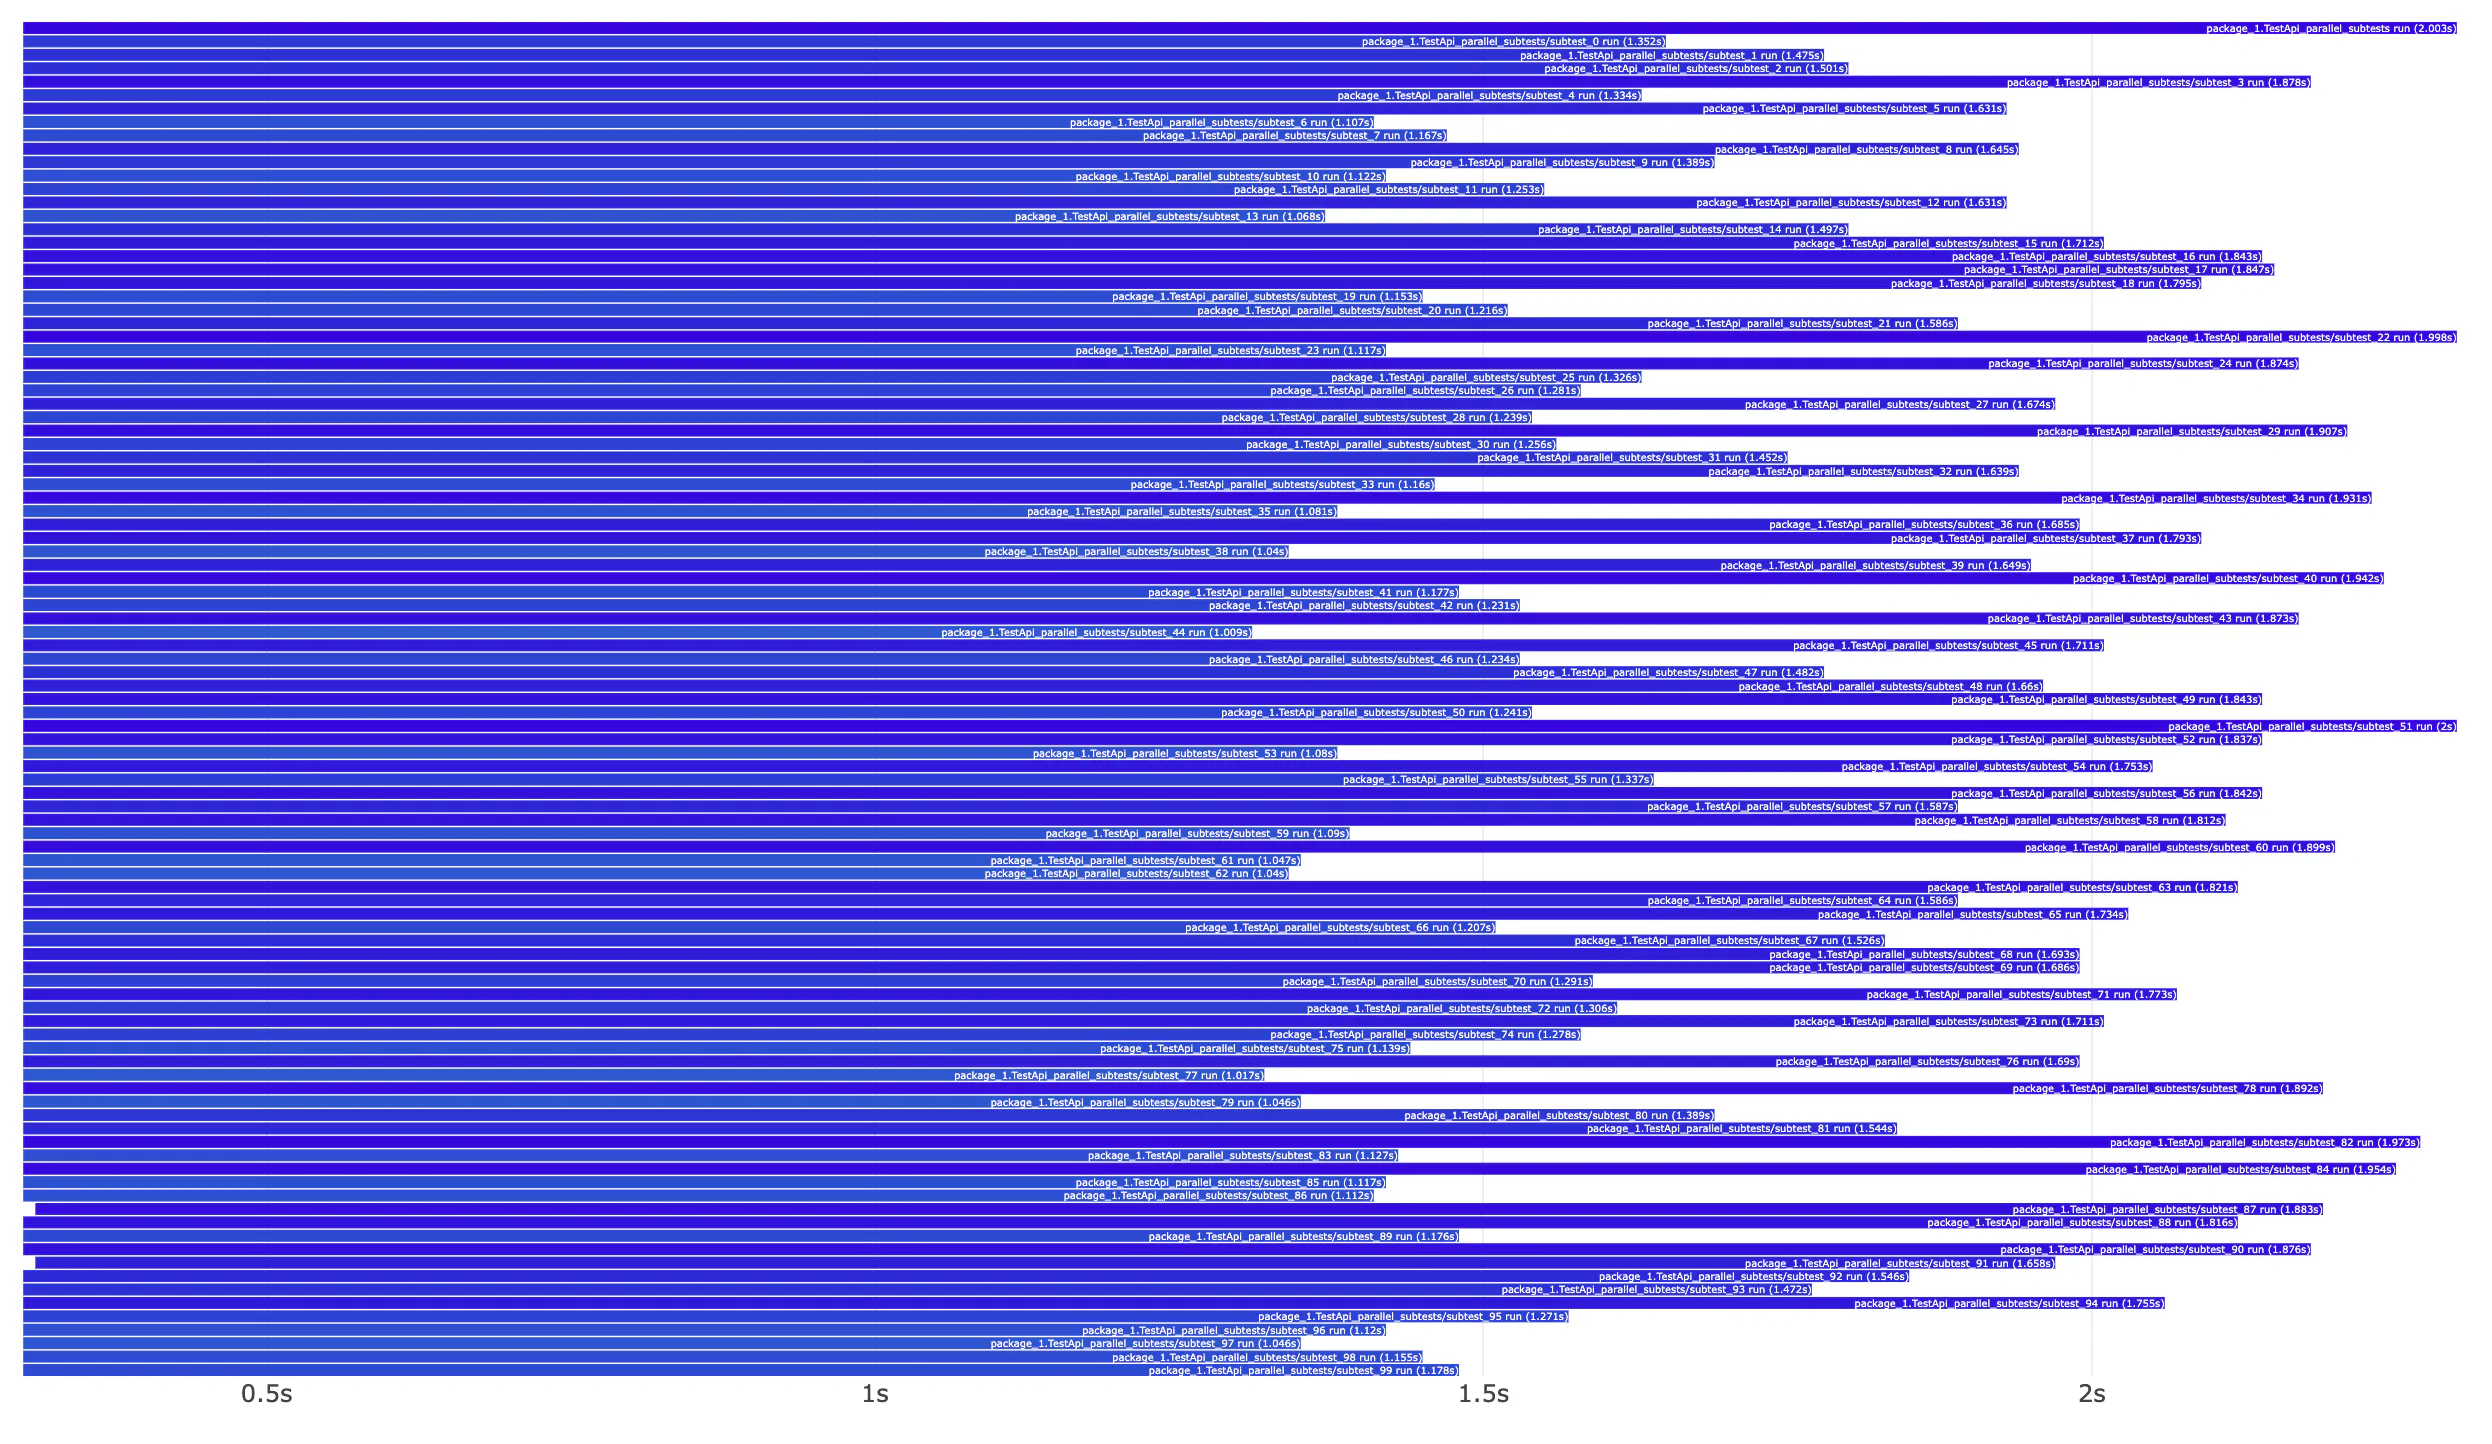
We achieved our goal - all tests run in parallel. Our tests were not CPU-bound, so the overall execution time can be as long as the slowest executed test.
Tip
If you are not changing the test code and want to test their performance, Go may cache them.
To avoid caching, run them with the -count=1 flag, for example go test ./... -json -count=1 -parallel=100 | vgt.
Tests in multiple packages
Using the -parallel flag is not the only thing we can do to speed up tests.
It’s not uncommon to store tests in multiple packages.
By default, Go limits how many packages can run simultaneously to the number of cores.
Let’s look at the example project structure:
$ ls ./tests/*

./tests/package_1:
api_test.go

./tests/package_2:
api_test.go

./tests/package_3:
api_test.go
Usually, we may have many more packages with tests for more complex projects. For readability, let’s simulate how tests will run on one CPU (for example, in a CI runner with 1 core):
GOMAXPROCS=1 go test ./tests/... -parallel 100 -json | vgt
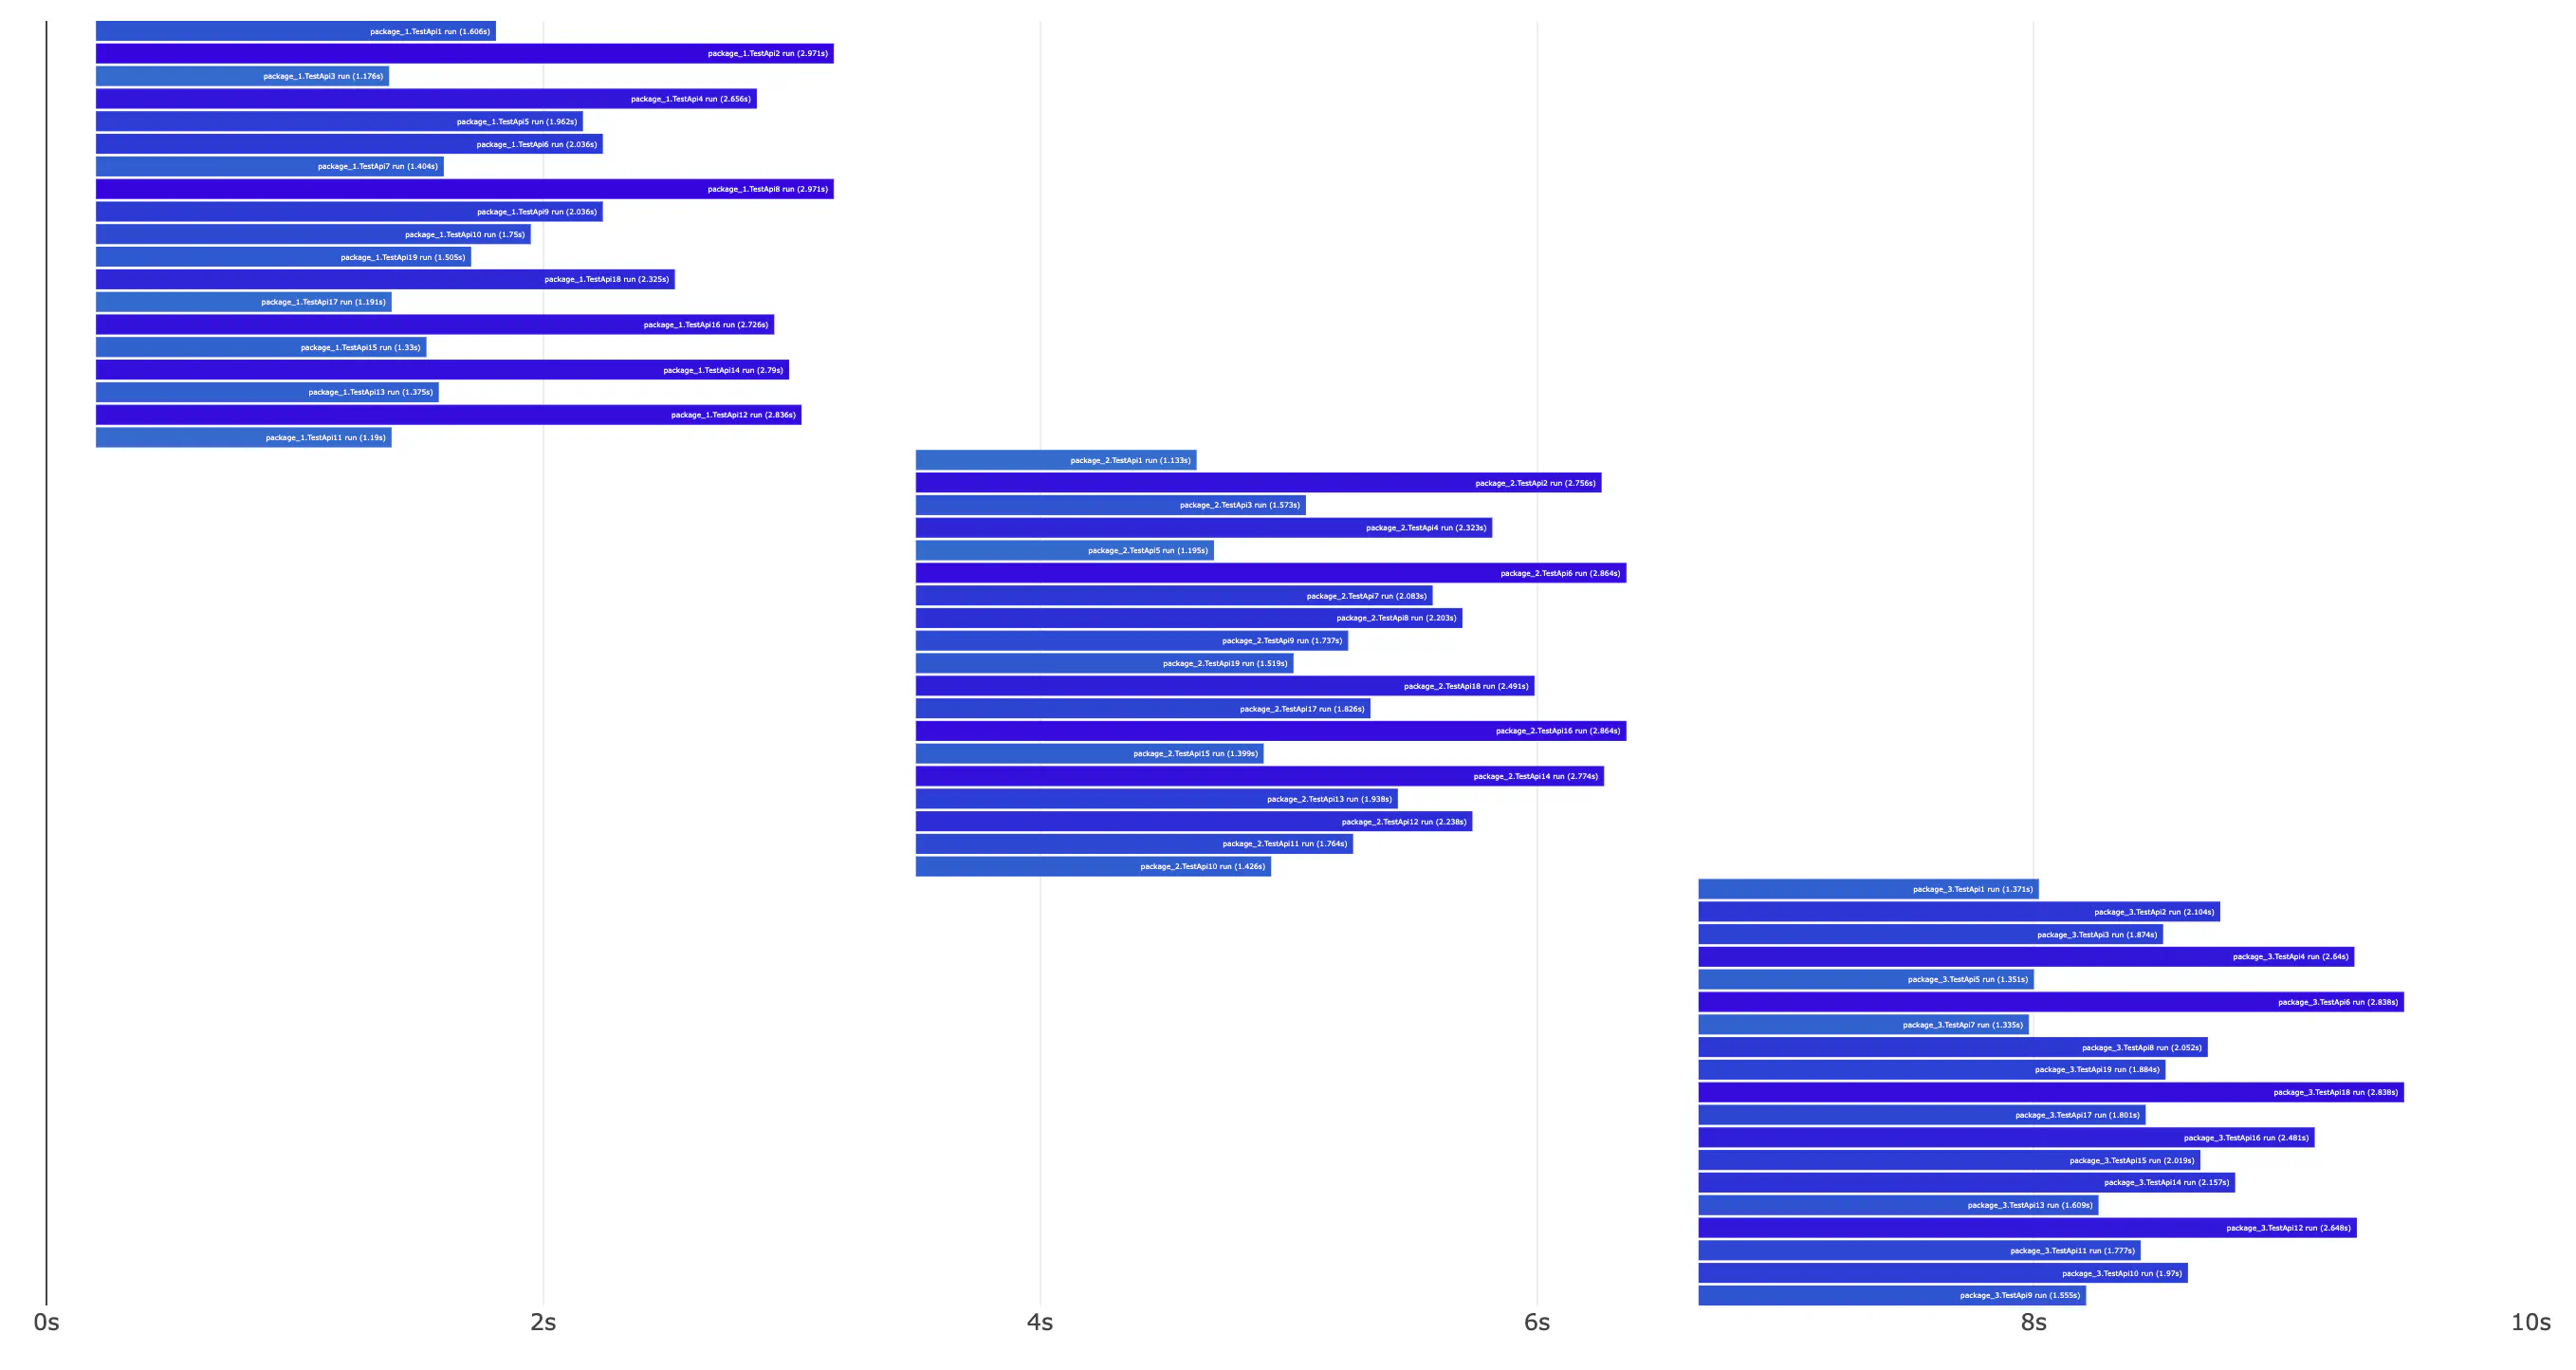
You can see that every package runs separately. We can fix this with the -p flag.
It may not be a problem if your tests run on machines with multiple cores
and you don’t have many packages with long-running tests.
But in our scenario, with CI and one core, we need to specify the -p flag.
It will allow up to 16 packages to run in parallel.
GOMAXPROCS=1 go test ./tests/... -parallel 128 -p 16 -json | vgt
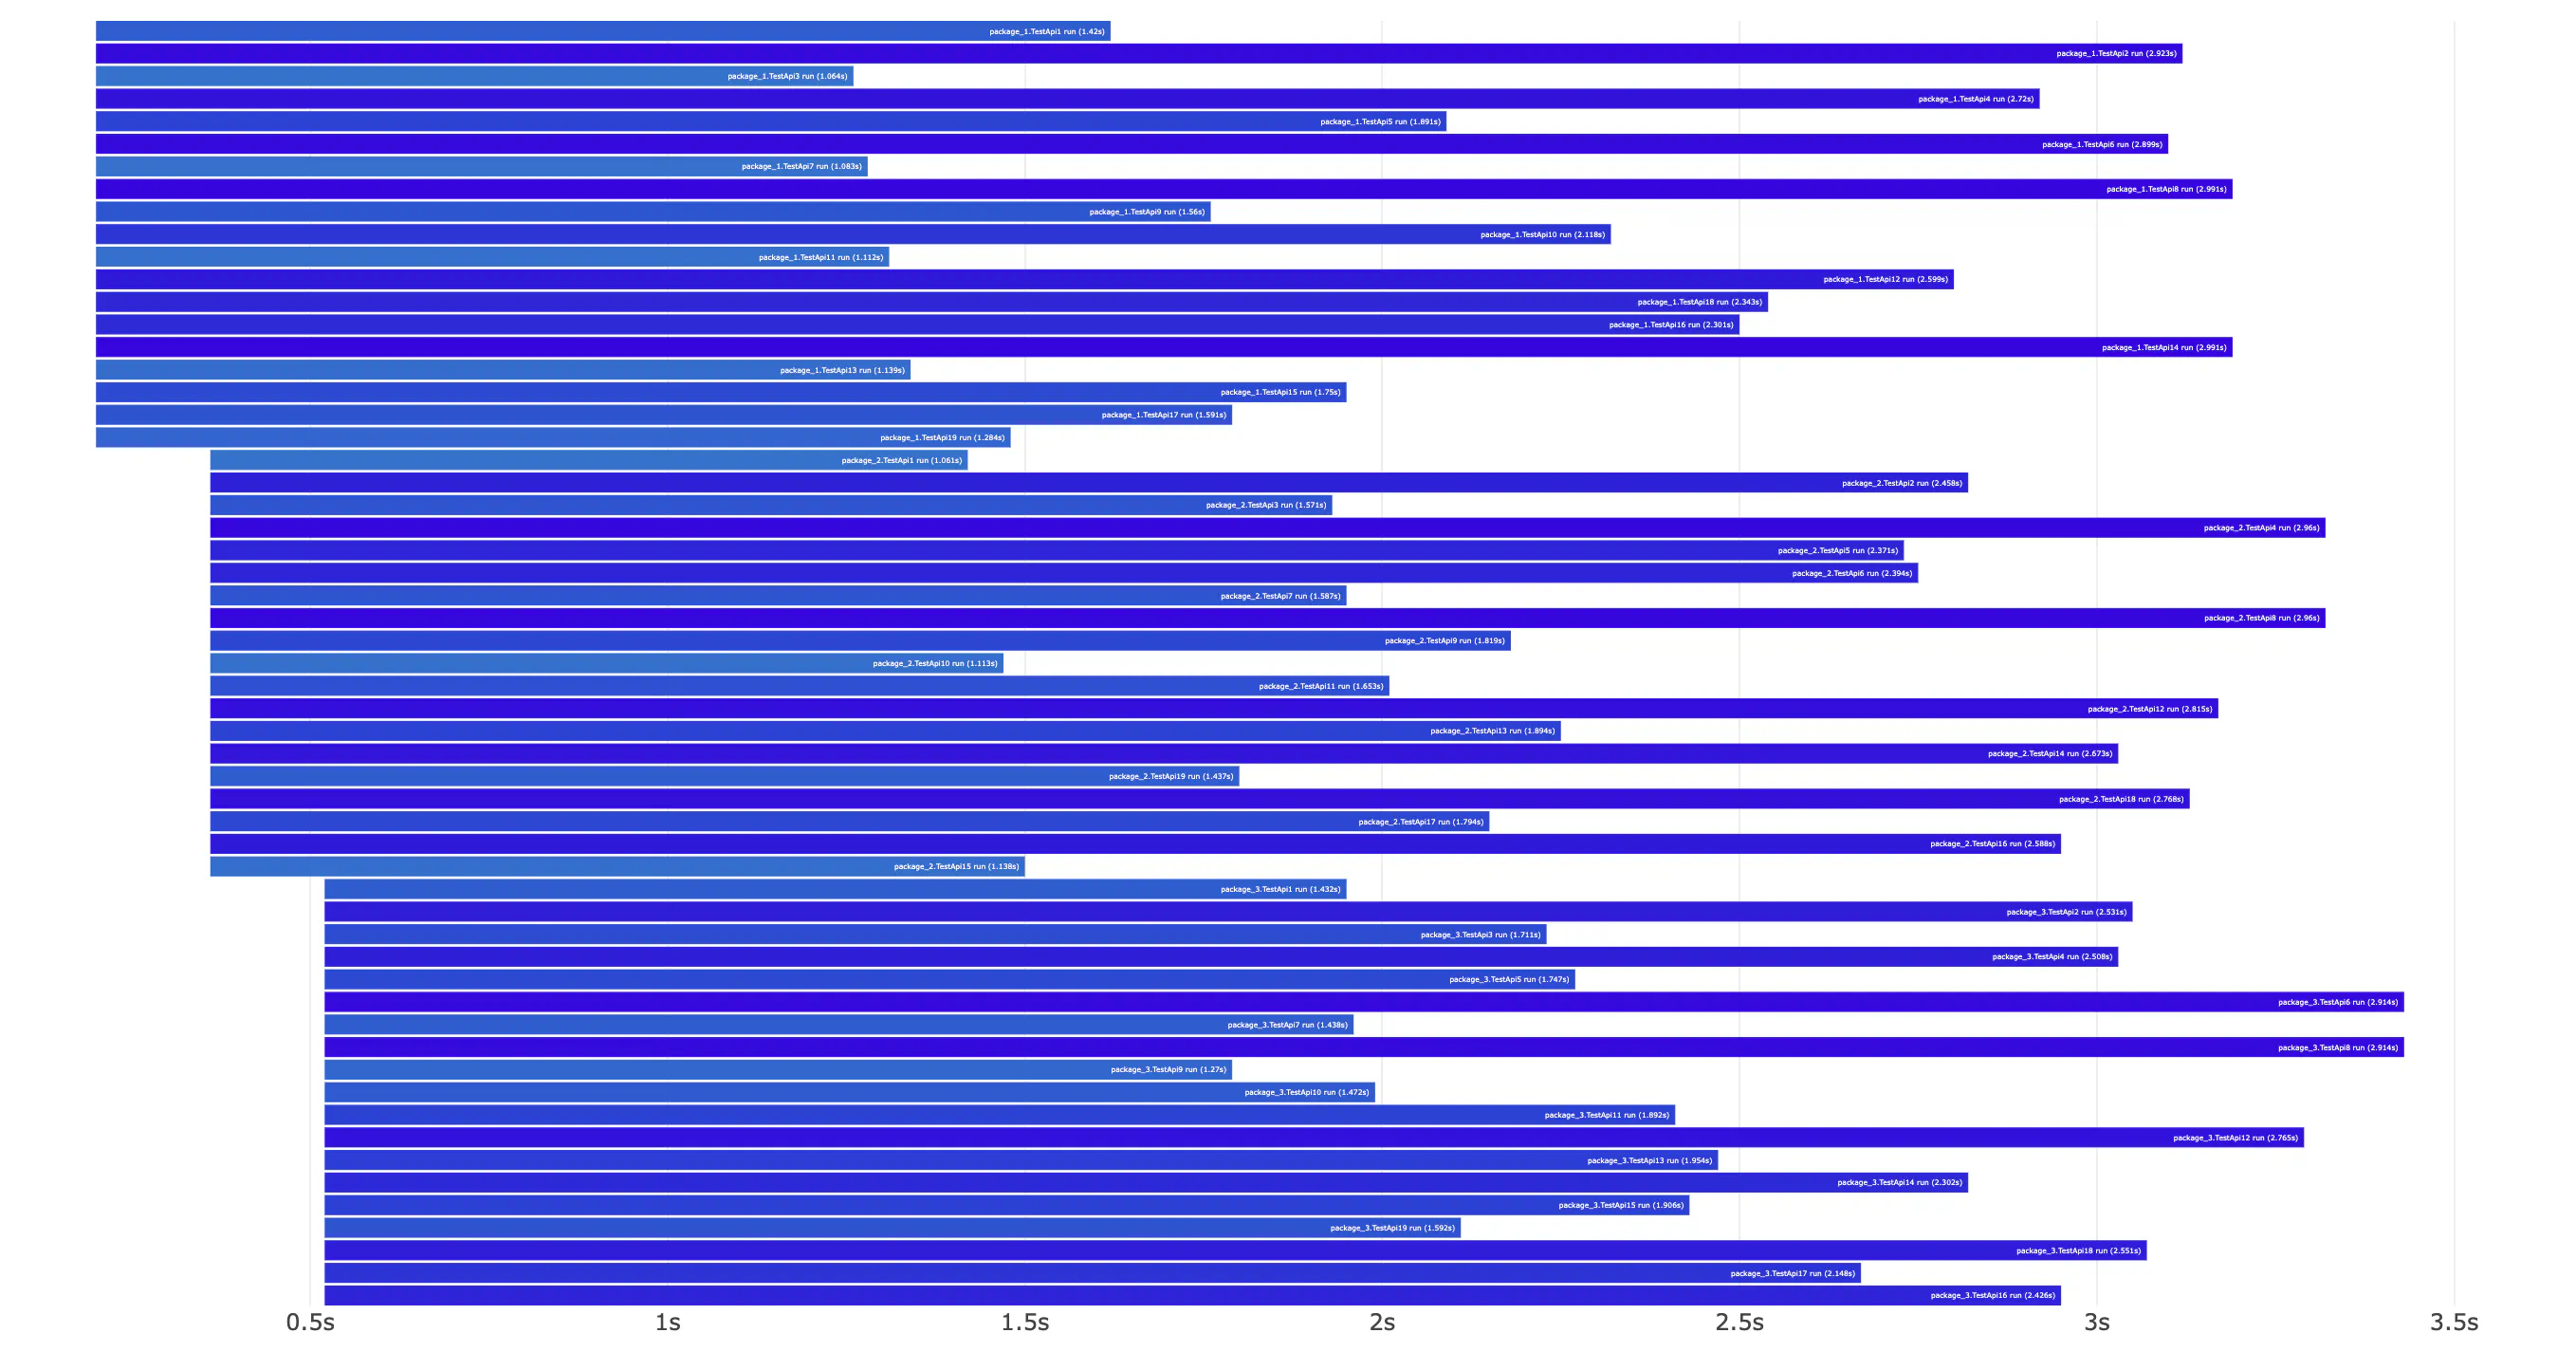
Now, the entire execution time is very close to the longest test duration.
Tip
It’s hard to give -parallel and -p values that will work for all projects.
It depends a lot on your types of tests and how they are structured.
The default value will work fine for many lightweight unit tests or
CPU-bound tests that efficiently use multiple cores.
The best way to find the correct -parallel flag is to experiment with different values.
vgt may be helpful in understanding how different values affect test execution.
Parallelism with sub-tests and test tables
Using test tables for tests in Go is very useful when you need to test many input parameters for a function. On the other hand, they have a couple of dangers: creating test tables may sometimes be more complex than just copying the test body multiple times.
Using test tables can also affect the performance of our tests a lot if we forget to add t.Parallel().
This is especially visible for test tables with a lot of slow test cases.
Even one use of test table can make our tests considerably slower.
func TestApi_with_test_table(t *testing.T) {
    t.Parallel()

    testCases := []struct {
       Name string
       API  string
    }{
       {Name: "1", API: "/api/1"},
       {Name: "2", API: "/api/2"},
       {Name: "3", API: "/api/3"},
       {Name: "4", API: "/api/4"},
       {Name: "5", API: "/api/5"},
       {Name: "6", API: "/api/6"},
       {Name: "7", API: "/api/7"},
       {Name: "8", API: "/api/8"},
       {Name: "9", API: "/api/9"},
       {Name: "10", API: "/api/9"},
       {Name: "11", API: "/api/1"},
       {Name: "12", API: "/api/2"},
       {Name: "13", API: "/api/3"},
       {Name: "14", API: "/api/4"},
       {Name: "15", API: "/api/5"},
       {Name: "16", API: "/api/6"},
       {Name: "17", API: "/api/7"},
       {Name: "18", API: "/api/8"},
       {Name: "19", API: "/api/9"},
    }
    for i := range testCases {
       t.Run(tc.Name, func(t *testing.T) {
          t.Parallel()
          simulateSlowCall(1 * time.Second)
       })
    }
}
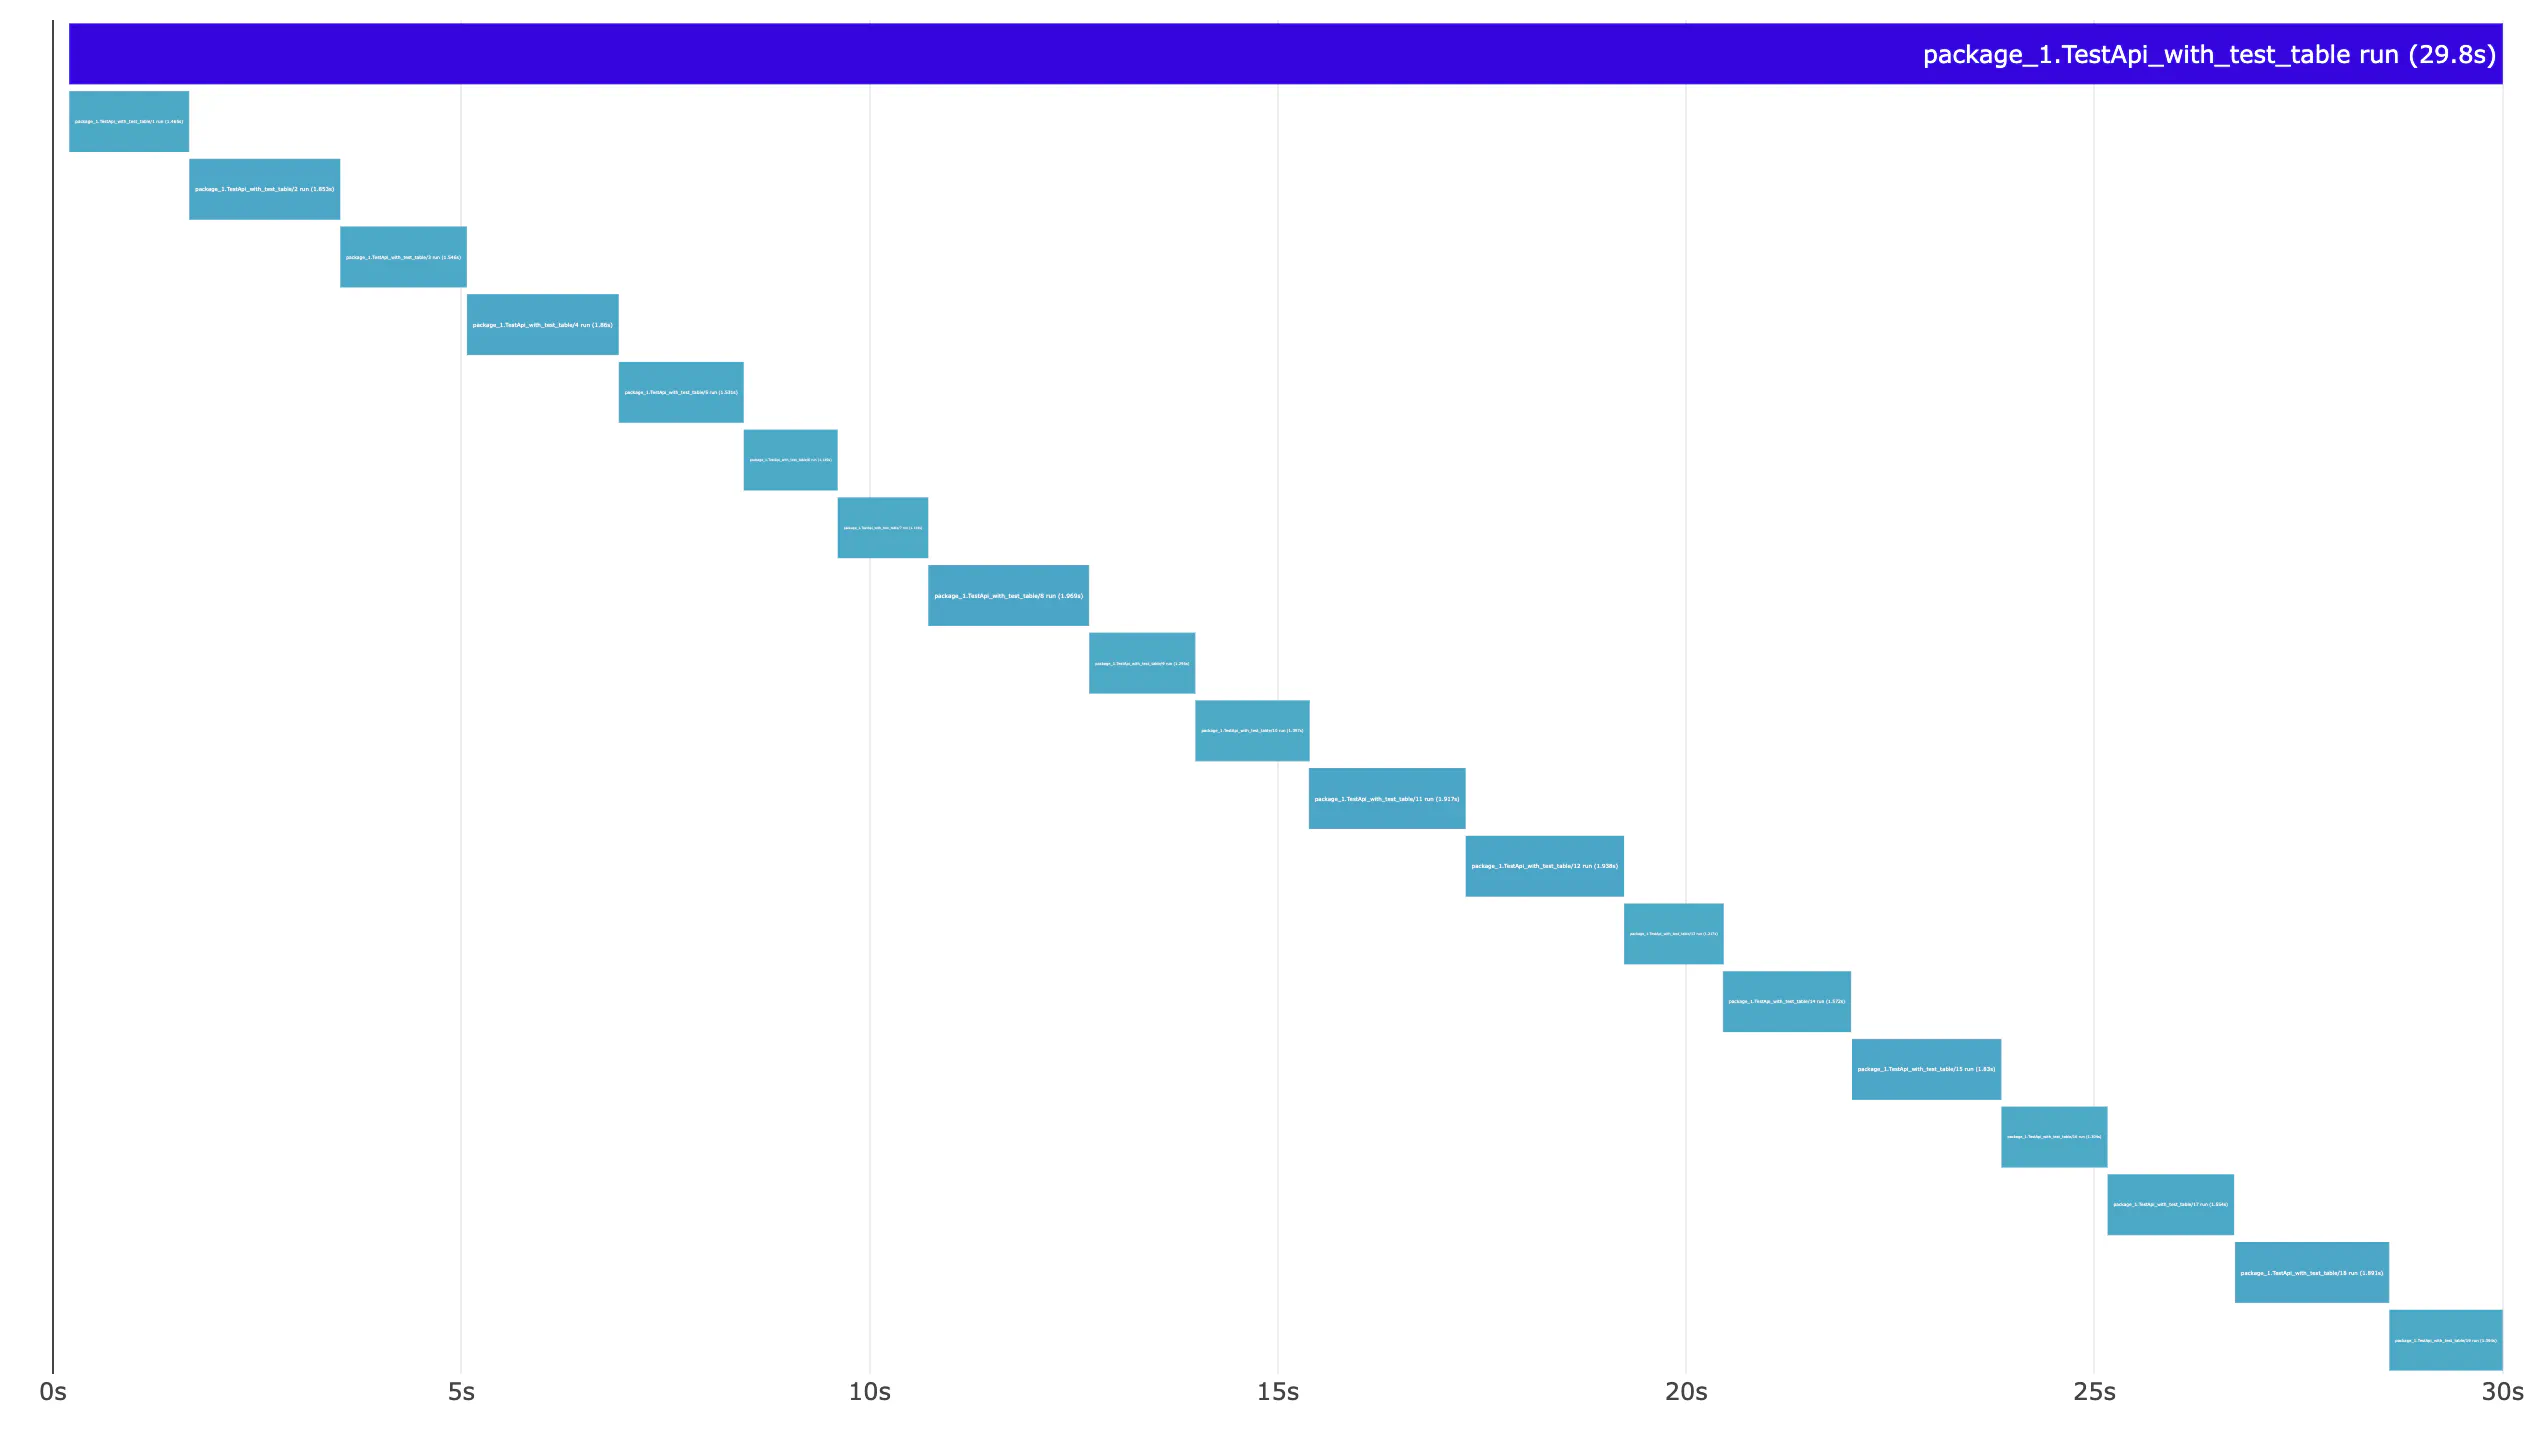
The solution is simple: add t.Parallel() to the test table.
But it’s easy to forget about it.
We can be careful when using test tables.
But being careful doesn’t always work in the real world when you’re in a hurry.
We need an automated way to ensure that t.Parallel() is not missed.
Linting if t.Parallel() is used
In most projects, we use golangci-lint.
It allows you to configure multiple linters and set them up for the entire project.
We can configure which linter should be enabled based on the file name.
An example configuration will ensure all tests in files ending with _api_test.go or _integ_test.go are using t.Parallel().
Unfortunately, as a downside, it requires keeping a convention in naming test files.
Tip
Alternatively, you can group your tests by type in multiple packages. So, one package can contain API tests, and another can contain integration tests.
Note
As mentioned earlier, it’s not only pointless, but even slower to use t.Parallel() for all kinds of tests.
Avoid requiring t.Parallel() for all types of tests.
This is an example .golangci.yml configuration:
run:
  timeout: 5m

linters:
  enable:
    # ...
    - paralleltest

issues:
  exclude-rules:
    # ...
    - path-except: _api_test\.go|_integ_test\.go
      linters:
        - paralleltest
With this config, we can run the linter:
$ golangci-lint run

package_1/some_api_test.go:9:1: Function TestApi_with_test_table missing the call to method parallel (paralleltest)
func TestApi_with_test_table(t *testing.T) {
^
You can find a reference for configuration in golangci-lint docs.
Tip
Not all tests can always run in parallel. In this case, you can disable the linter for this specific test with //nolint:paralleltest.
//nolint:paralleltest
func SomeTest(t *testing.T) {

    //nolint:paralleltest
    t.Run("some_sub_test", func(t *testing.T) {

    })
}
Parallelism quirks: does grouping tests with t.Run() affect performance?
I’ve often seen in many projects a convention of grouping tests with t.Run().
Have you ever wondered if it affects performance in any way?
To check this hypothesis, I wrote 50 tests like this:
func TestApi1(t *testing.T) {
    t.Parallel()

    t.Run("1", func(t *testing.T) {
       t.Run("1", func(t *testing.T) {
          t.Run("1", func(t *testing.T) {
             simulateSlowCall(1 * time.Second)
          })
       })
    })

    t.Run("2", func(t *testing.T) {
       t.Run("2", func(t *testing.T) {
          t.Run("2", func(t *testing.T) {
             simulateSlowCall(1 * time.Second)
          })
       })
    })
}

func simulateSlowCall(sleepTime time.Duration) {
    // for more reliable results I'm using constant time here
    time.Sleep(sleepTime)
}
To compare, I also wrote 50 tests without using t.Run() for subtests:
func TestApi1(t *testing.T) {
t.Parallel()

simulateSlowCall(1 * time.Second)
simulateSlowCall(1 * time.Second)
}

func simulateSlowCall(sleepTime time.Duration) {
// for more reliable results I'm using constant time here
time.Sleep(sleepTime)
}
Does it affect test performance by affecting parallelism in any way?
Let’s see what vgt will show us.
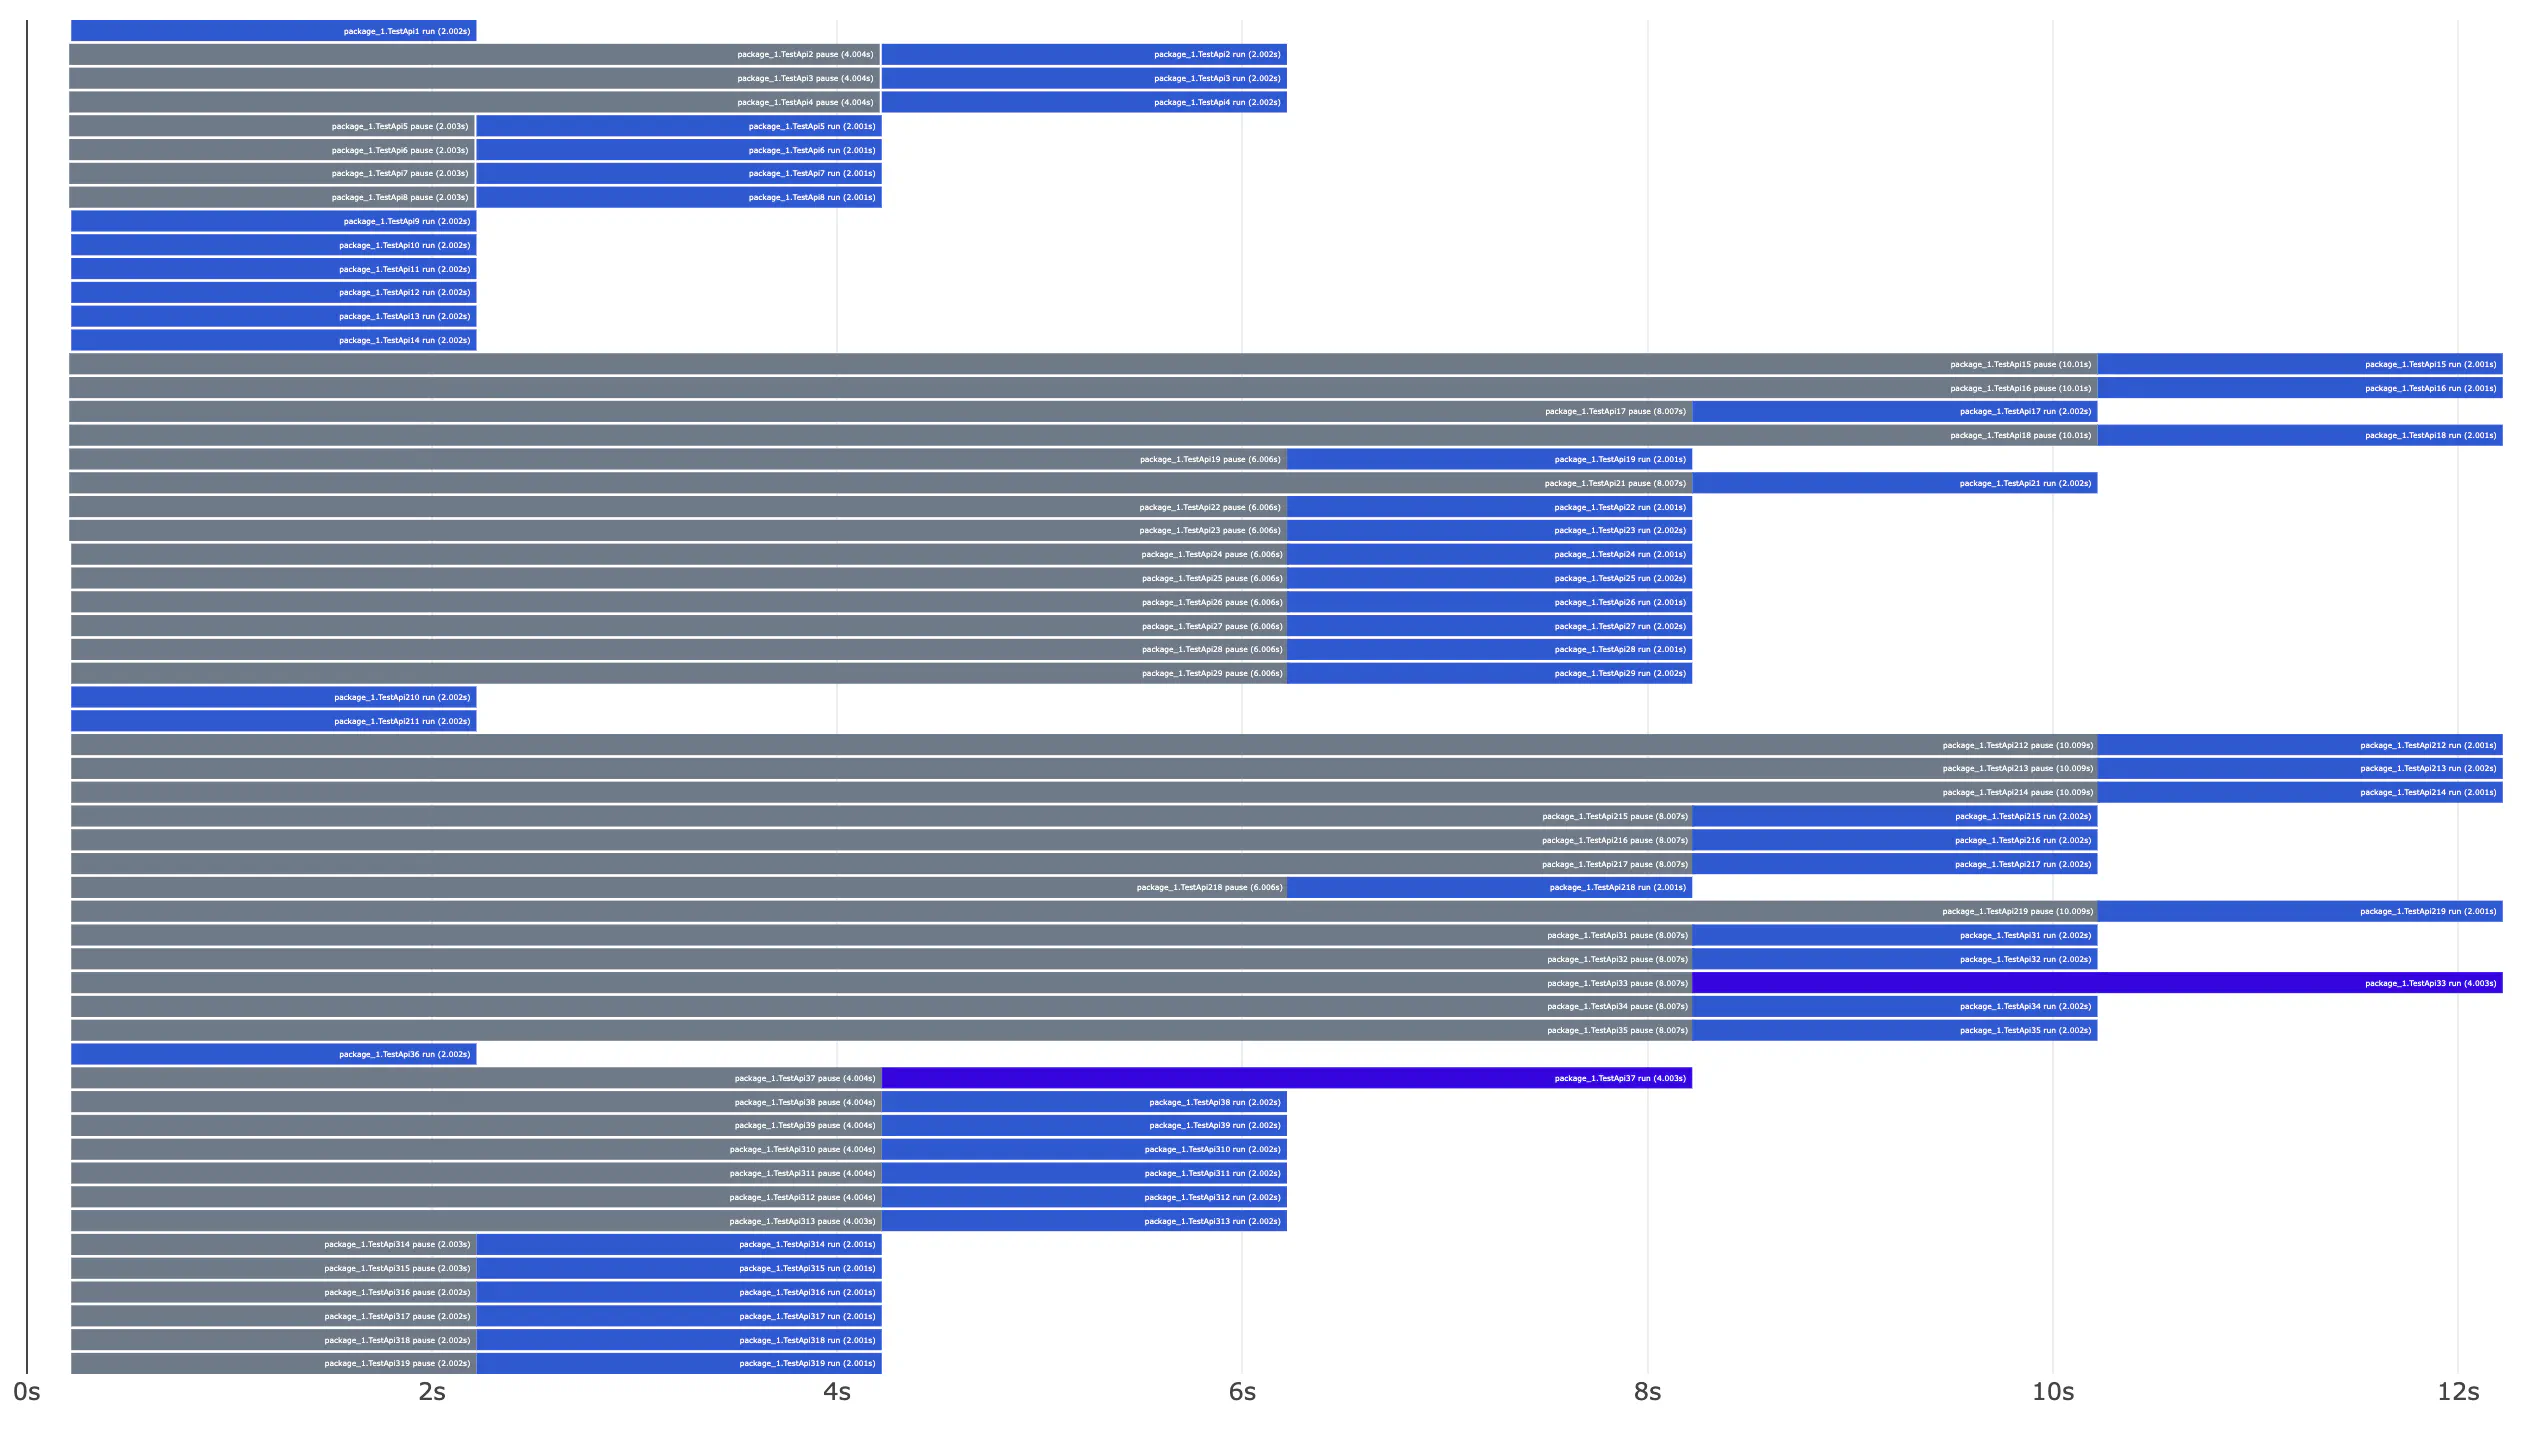
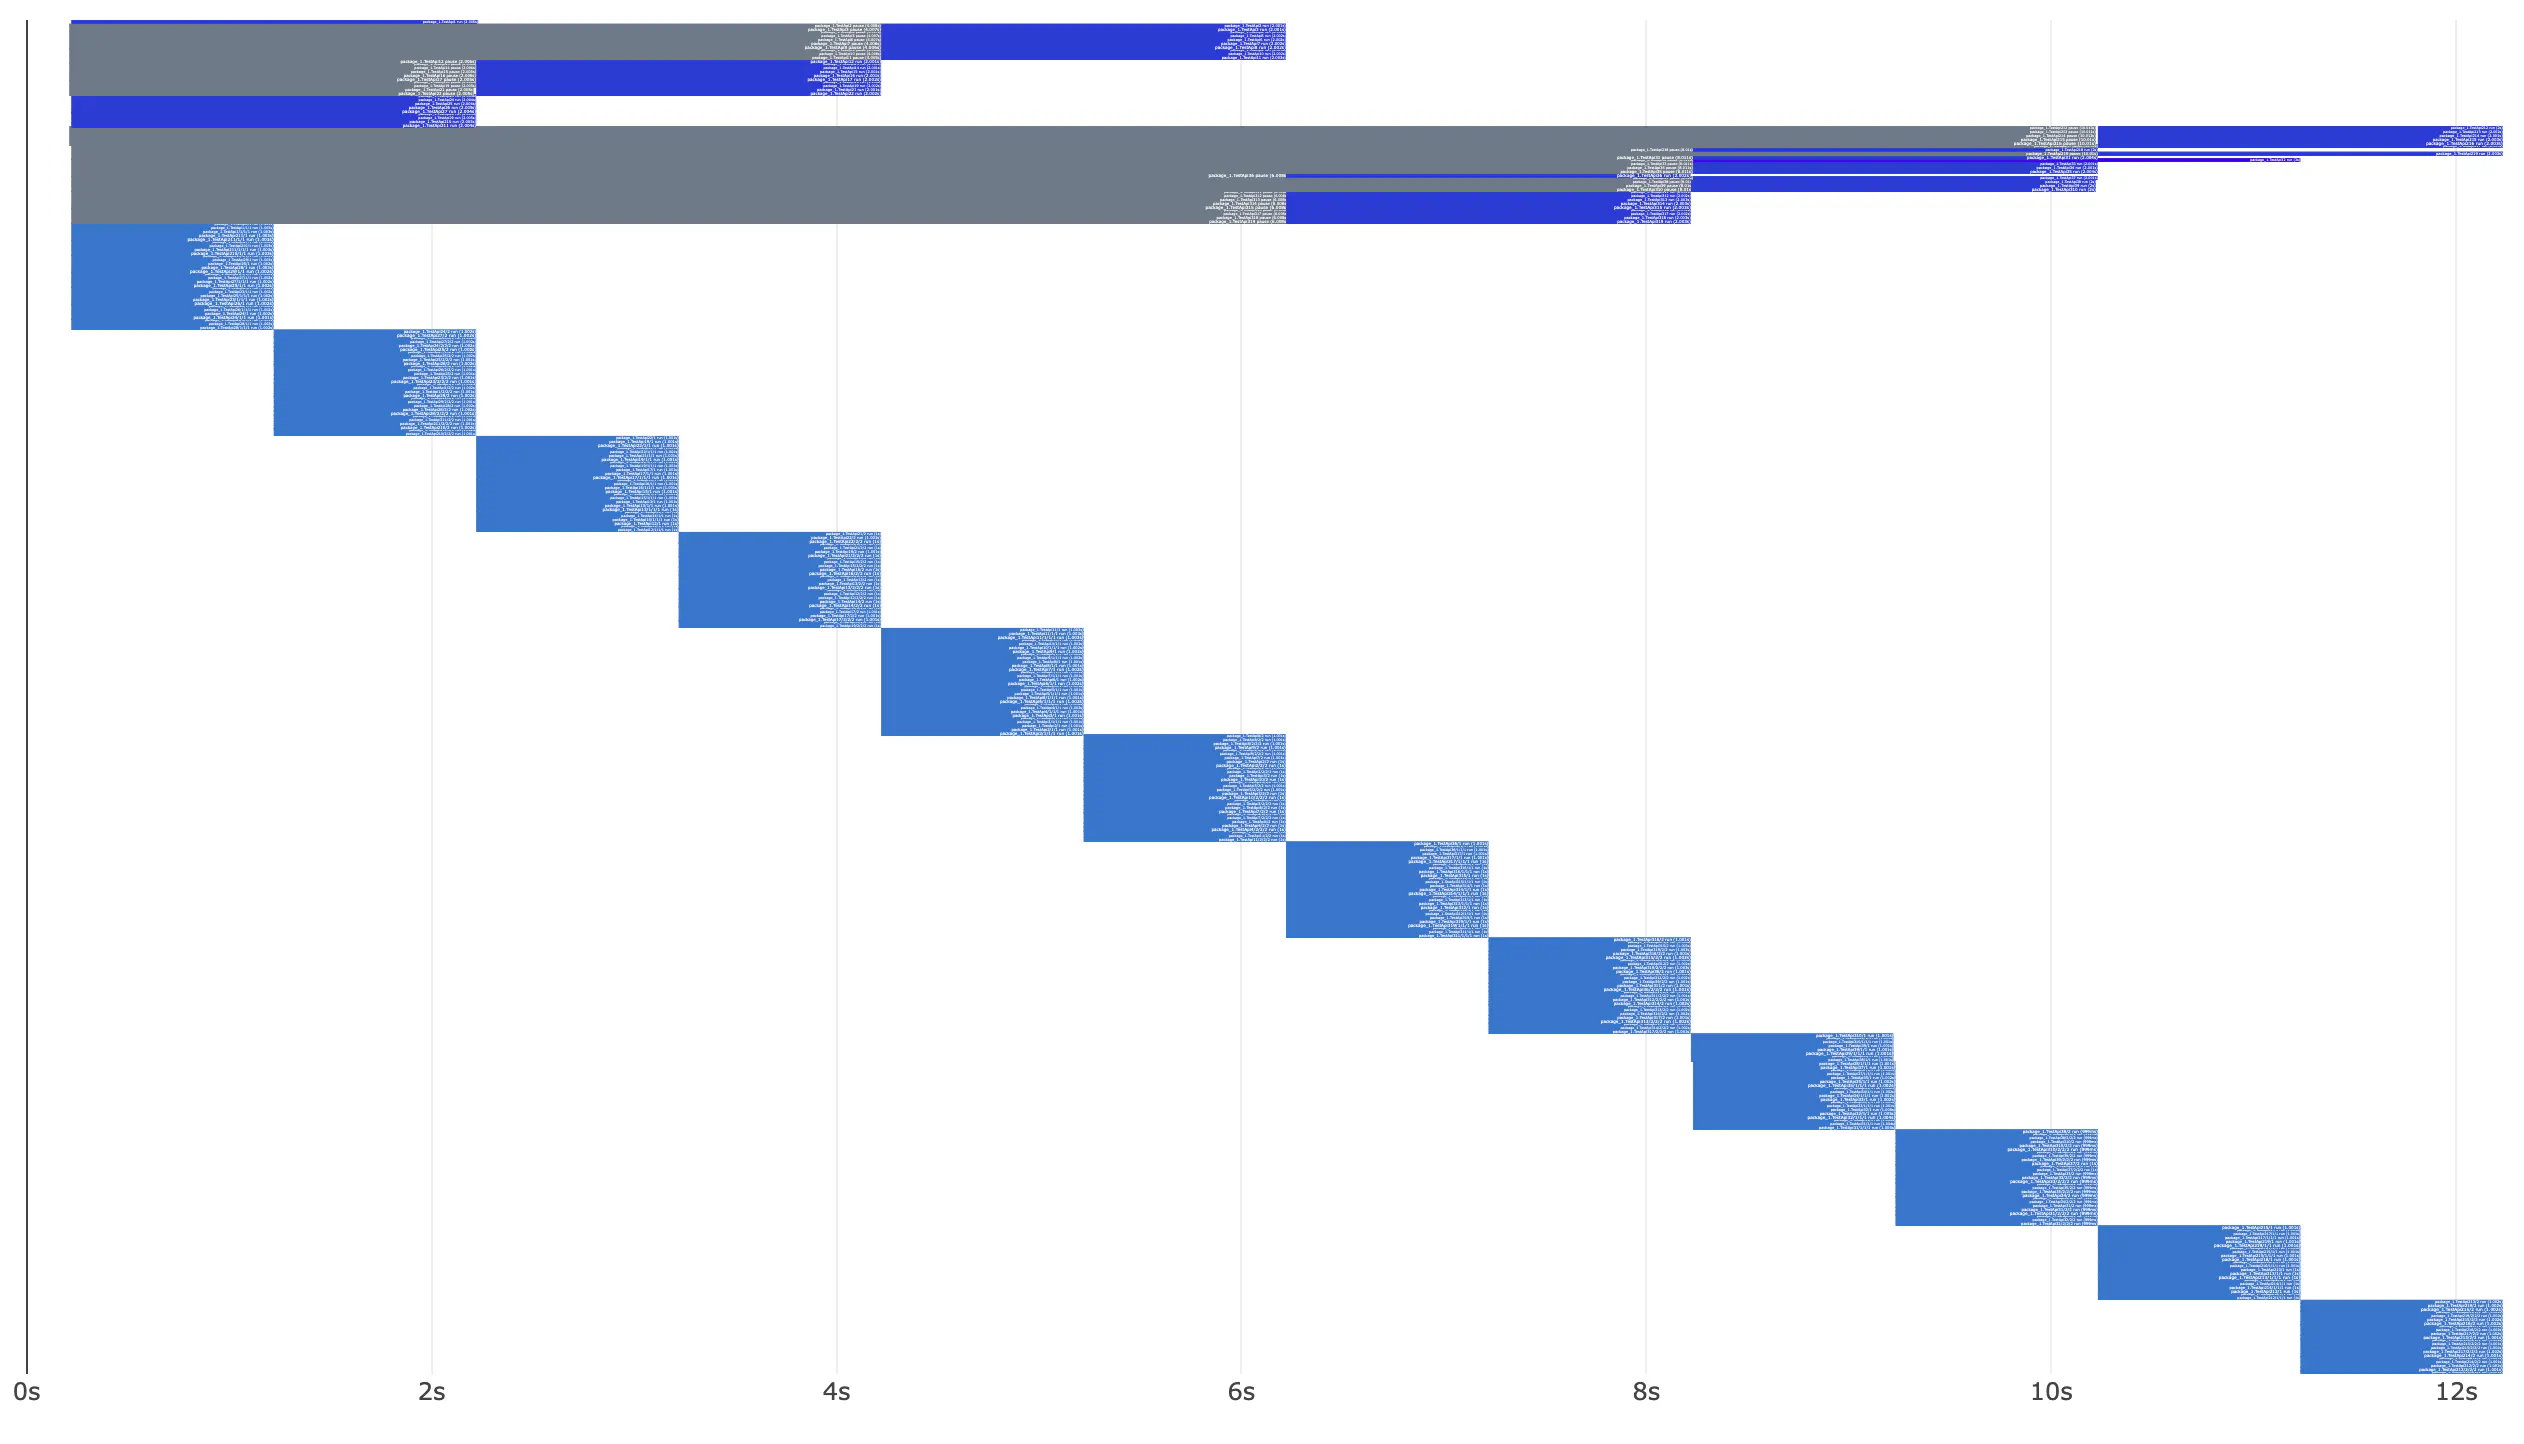
Despite the chart looking a bit uglier, execution times are the same for grouped and non-grouped tests.
In other words, grouping tests with t.Run() does not affect performance.
Summary
Having fast and reliable tests for efficient development is crucial. But over the years, I’ve learned that reality is not always so simple. There is always more work to do, and tests are not something that our product’s users or boss directly see. On the other hand, a small investment in tests can save a lot of time in the future. Reliable and fast tests are one of the best investments in your project’s return on investment (ROI).
Knowing some tactics to convince your team leader or manager to find time to improve tests is useful. It’s helpful to think in terms that your manager or boss uses. You should consider the benefits they care about. Reducing delivery time - you can even calculate how many minutes per month the entire team wastes by waiting for tests or retrying them. It may be useful to multiply this by the average developer’s salary. It’s also helpful to track bugs shipped to production because tests were so flaky that nobody noticed them.
There are more ways to make your tests more useful. I’ve also observed that people often struggle with naming different types of tests – we will give you some hints about that, too. If you are interested in more articles about testing, check out:
- 4 practical principles of high-quality database integration tests in Go
- Microservices test architecture
Is vgt useful for you?
Don’t forget to give it a star on GitHub and share it with your friends or social media!

